Daniel was lucky to attend and present at the International Biometric Conference (IBC) 2026 in Seoul, Korea. This time he took a lot of notes from the sessions he attended, and the following is the polished version of them. Enjoy!
OP.01 Monday 10:45-12:15 - Adaptive and Group Sequential Designs
OP.01.01 A 2-in-1 adaptive design for binary endpoints (Gosuke Homma, Astellas)
Intro: 2-in-1 adaptive design framework (Chen et al. 2018)
- Depending on the interim test statistic, either continue as phase II or expand to phase III.
- Identified gap: no established method for binary endpoints.
Advantages of the proposed design:
- Exact operating characteristic evaluation (no simulation required for core calculations).
- Applicable to multiple binary tests.
- R package is available on GitHub: adaptive2in1binary.
Method:
- Superiority setting.
- Compared tests: chi-square, Fisher exact, Fisher mid-p, Z-pooled, Boschloo (Boschloo 1970).
- General formula (product of binomial probability mass function terms) for power and type I error.
Results:
- The conventional chi-square test did not control type I error in examined scenarios.
- Recommended Boschloo exact unconditional test for strict type I error control and favorable power.
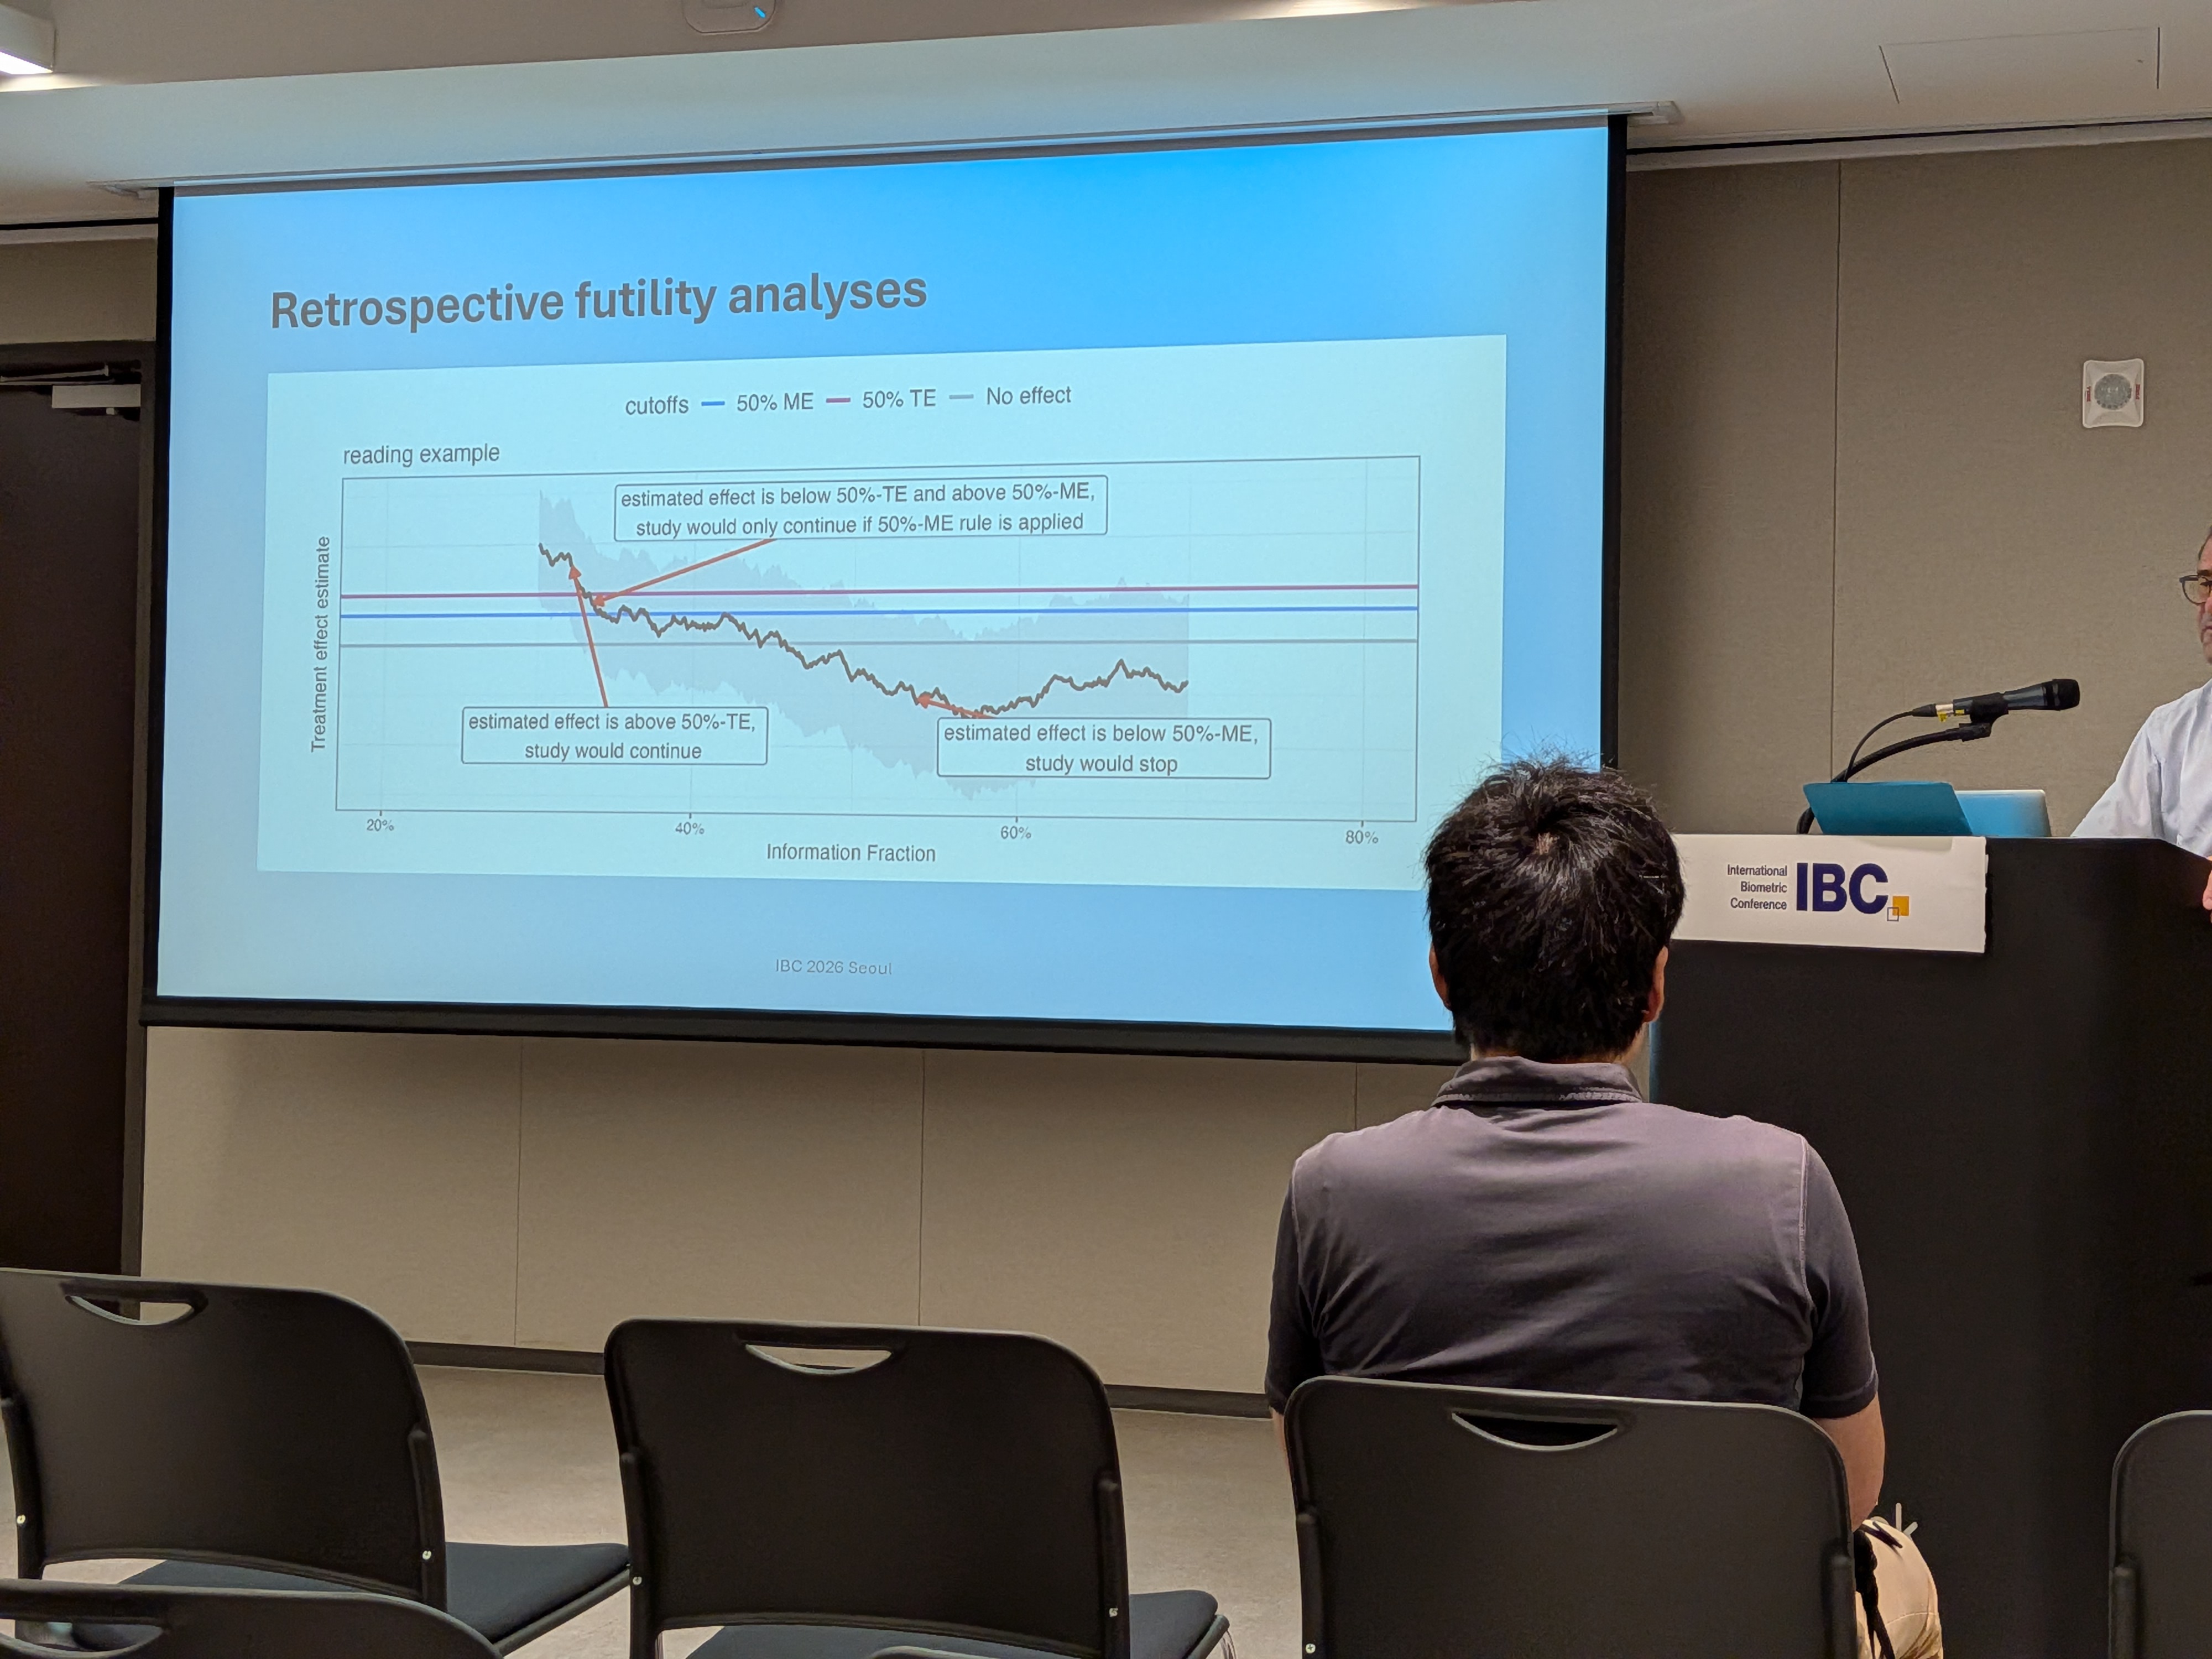
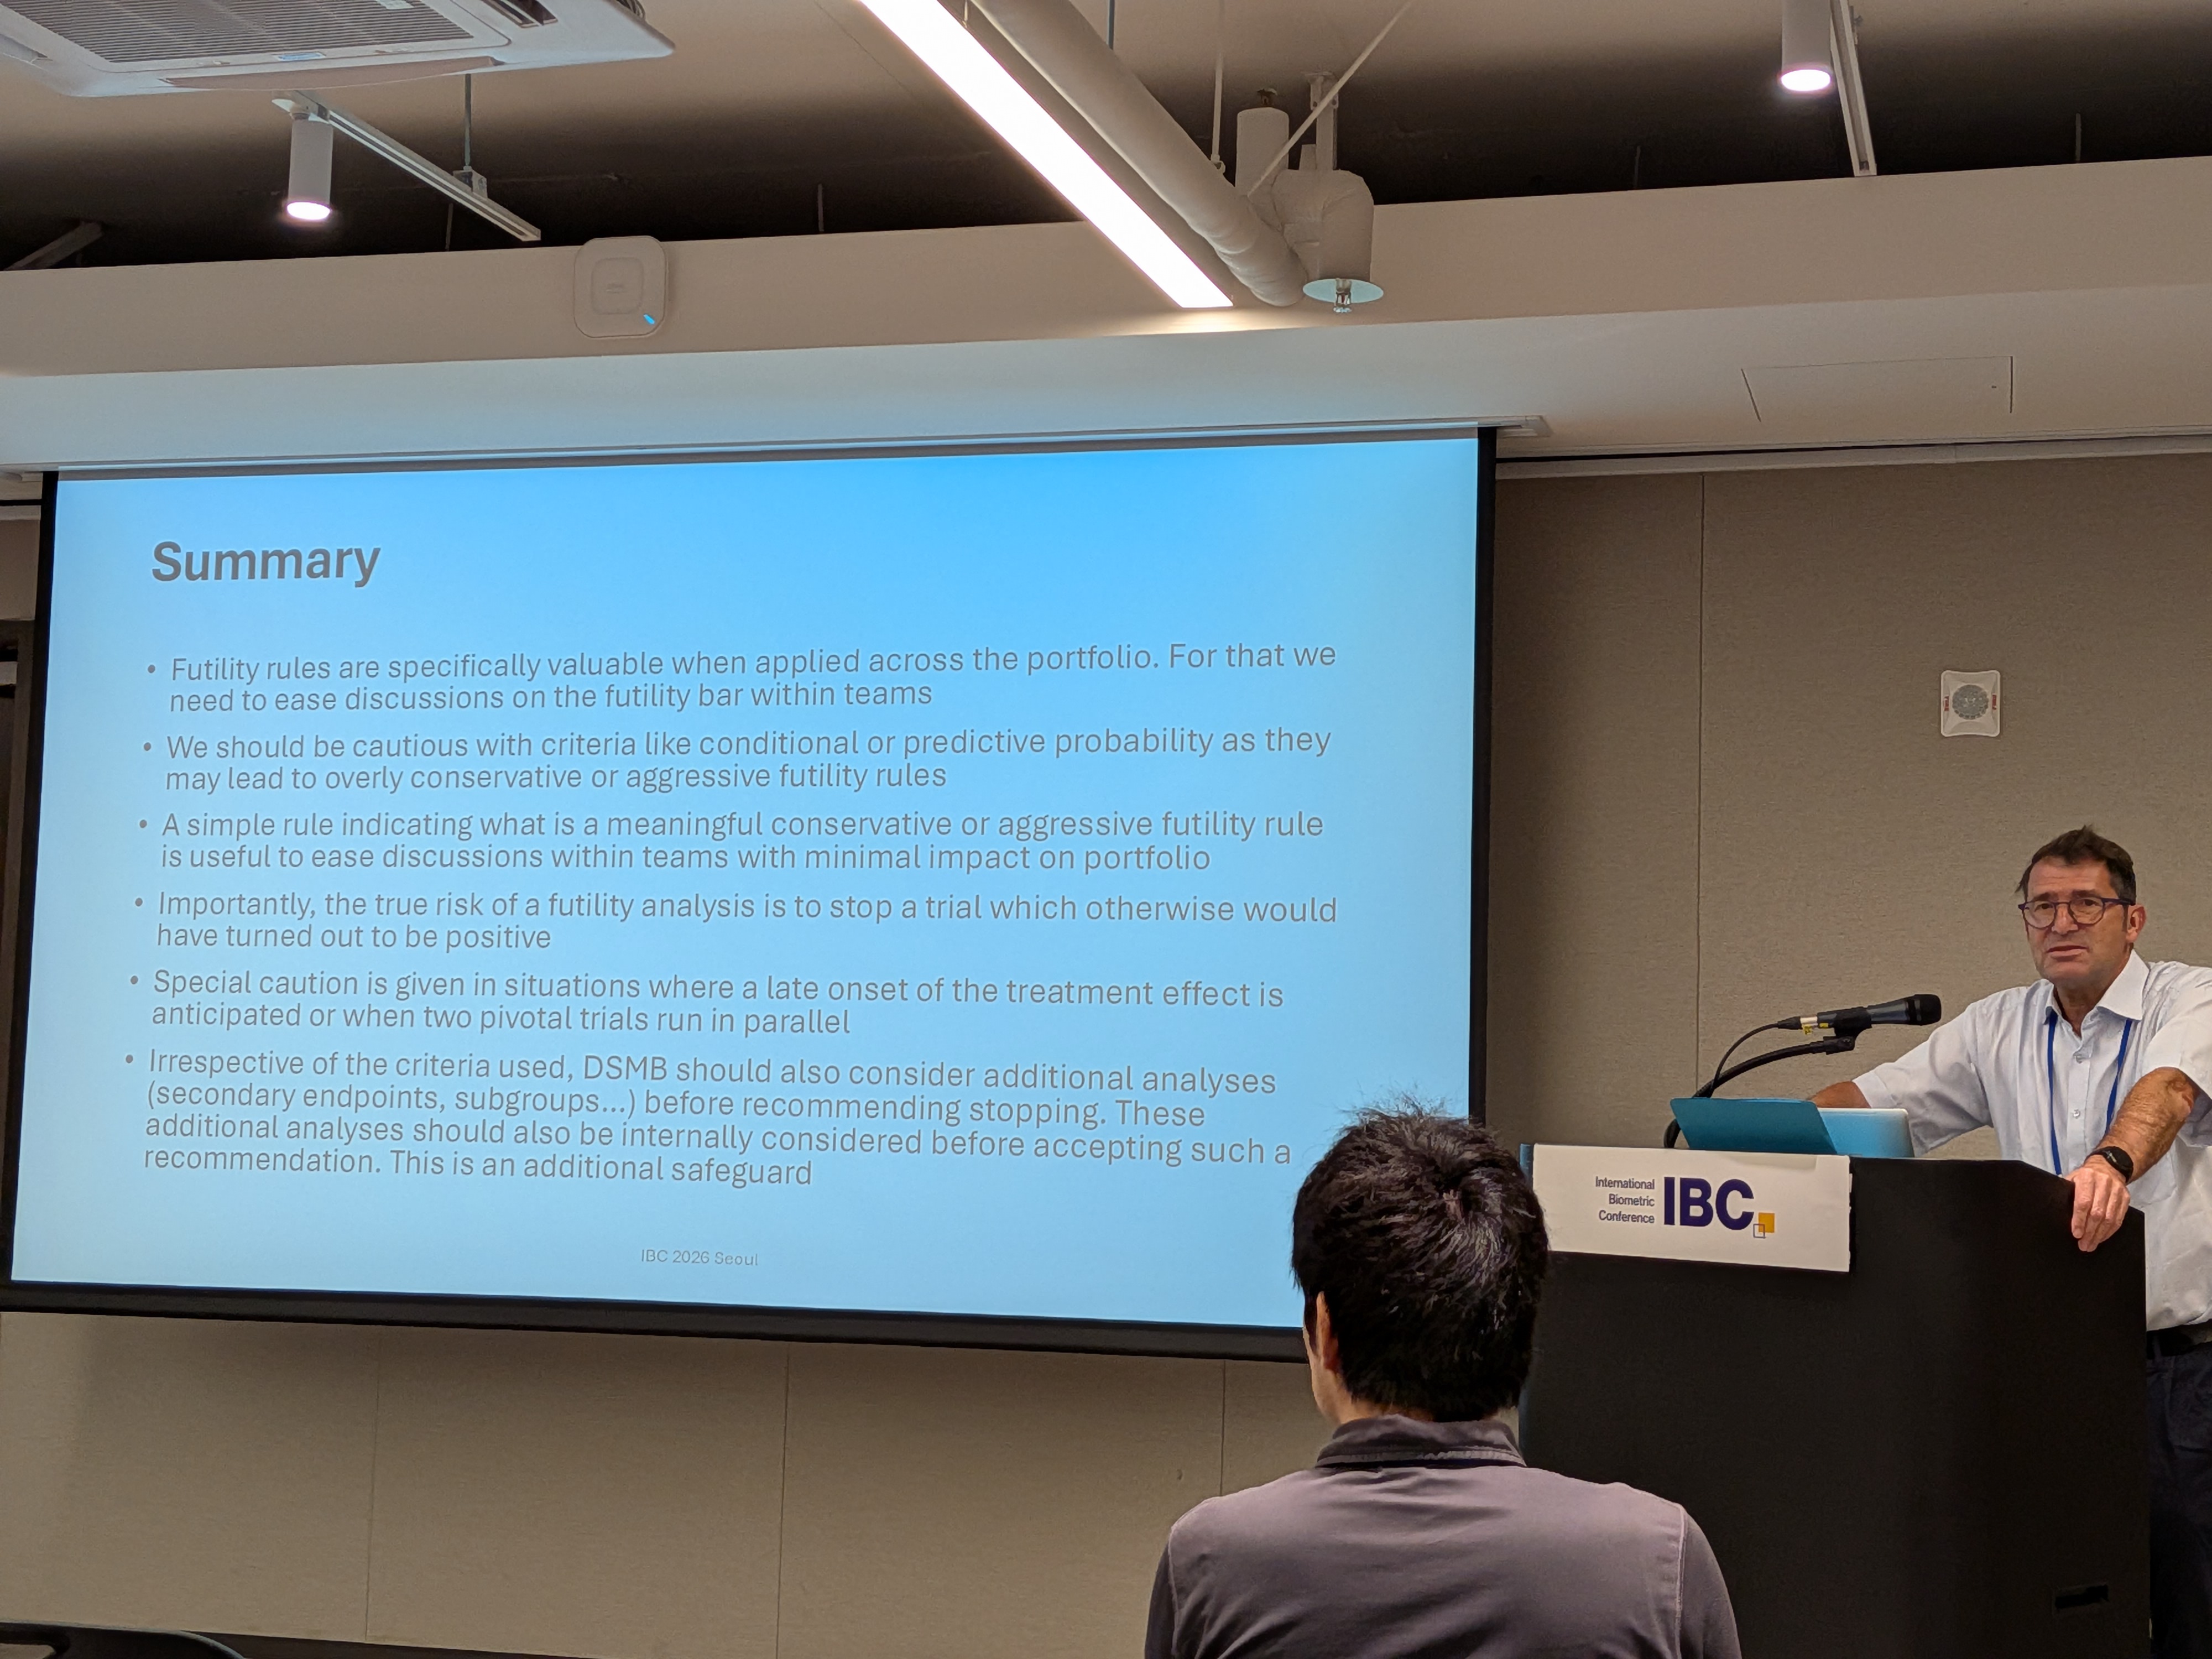
OP.01.02 Futility Analysis in pharmaceutical industry - How to make them more efficient (Hans Ulrich Burger, Universität Graz)
Current situation:
- Futility analyses are often underused.
- Thresholds are frequently too conservative.
- Team alignment on futility boundaries can be slow.
Proposal:
- Simple rule-based range for futility bars.
- Anchored to TPP and MVP.
- Proposed range: between 50% MVP and 50% TPP.
- Timing: around 50% information rate (practical range 30%–70%).
- Framed as an alternative to conditional-power or predictive-probability bars, which may be too conservative or too aggressive, respectively.
Evaluation:
- Retrospective review of completed phase III studies.
- 50% MVP would not have stopped positive studies in the reviewed set.
- 50% TPP would have stopped only selected positive cases at specific times.
- Both range endpoints would have stopped nearly all negative studies (one exception noted).
- Even when using the most “aggressive” 50% TPP rule, most of the stopped positive trials would have effects close to MVP, i.e. not very attractive for the sponsor and the patients.
Complex settings include:
- Development program with two phase III studies.
- Late treatment effects.
- Secondary endpoint, here the regulatory context becomes important.
Question discussed:
- What conservative futility bars are teams currently using in practice?
- Typically have seen 0-5% relative difference when the MVP is 20%. Here the proposal is 10-15% relative difference as a practical range for futility thresholds.
OP.01.03 A Bayesian Nonparametric Approach for Futility Interim Analysis (Ryusei Ozaki, University of Tokyo)
Background:
- Predictive probability is already a Bayesian interim decision framework.
- Existing formulas (for example Liu and Dressler (2018)) are typically parametric.
Aim:
- Avoid committing to a single parametric outcome distribution.
- Use a Dirichlet process mixture (DPM) model.
Proposal:
- Subject-level model via DPM of normal-inverse-gamma components.
- Computation:
- Obtain interim posterior via Gibbs sampling.
- Future outcomes from posterior predictive using Chinese Restaurant Process (CRP) allocation.
- Finally calculate futility metric via Monte Carlo integration.
Results:
- Simulation scenarios: normal, skewed mixture normal, symmetric mixture normal, heavy-tailed Student t (df = 10).
- Oracle comparison used predictive probability under true data-generating distribution.
- Larger concentration parameter M gave smaller predictive probabilities in reported settings.
- Differences reduced as information increased (sample size/information fraction).
OP.01.04 On Conditional Power Calculation in Group Sequential Designs: Using One Point or Multiple Points? (Nagi Kurita, University of Tokyo)
Introduction:
- Focus on futility stopping based on conditional power (CP).
- Question: how many interim analyses should be reflected in the CP calculation?
Conventional CP:
- Conditions on current interim test statistic.
- Uses Jennison-Turnbull approximation.
- Limitation: ignores subsequently planned interims!
Objective:
- Incorporate subsequent interims (Zhu et al. 2011), call this
CP_all. - Compare
CP_allversus conventionalCP_finaland oracle CP.
Results:
CP_allwas close to oracle CP in key scenarios.- Conventional
CP_finaltended to overestimate CP. CP_allcould underestimate true CP when standard deviation estimation was unstable.- This can be explained by the relationship between standard deviation estimation and the conditional power.
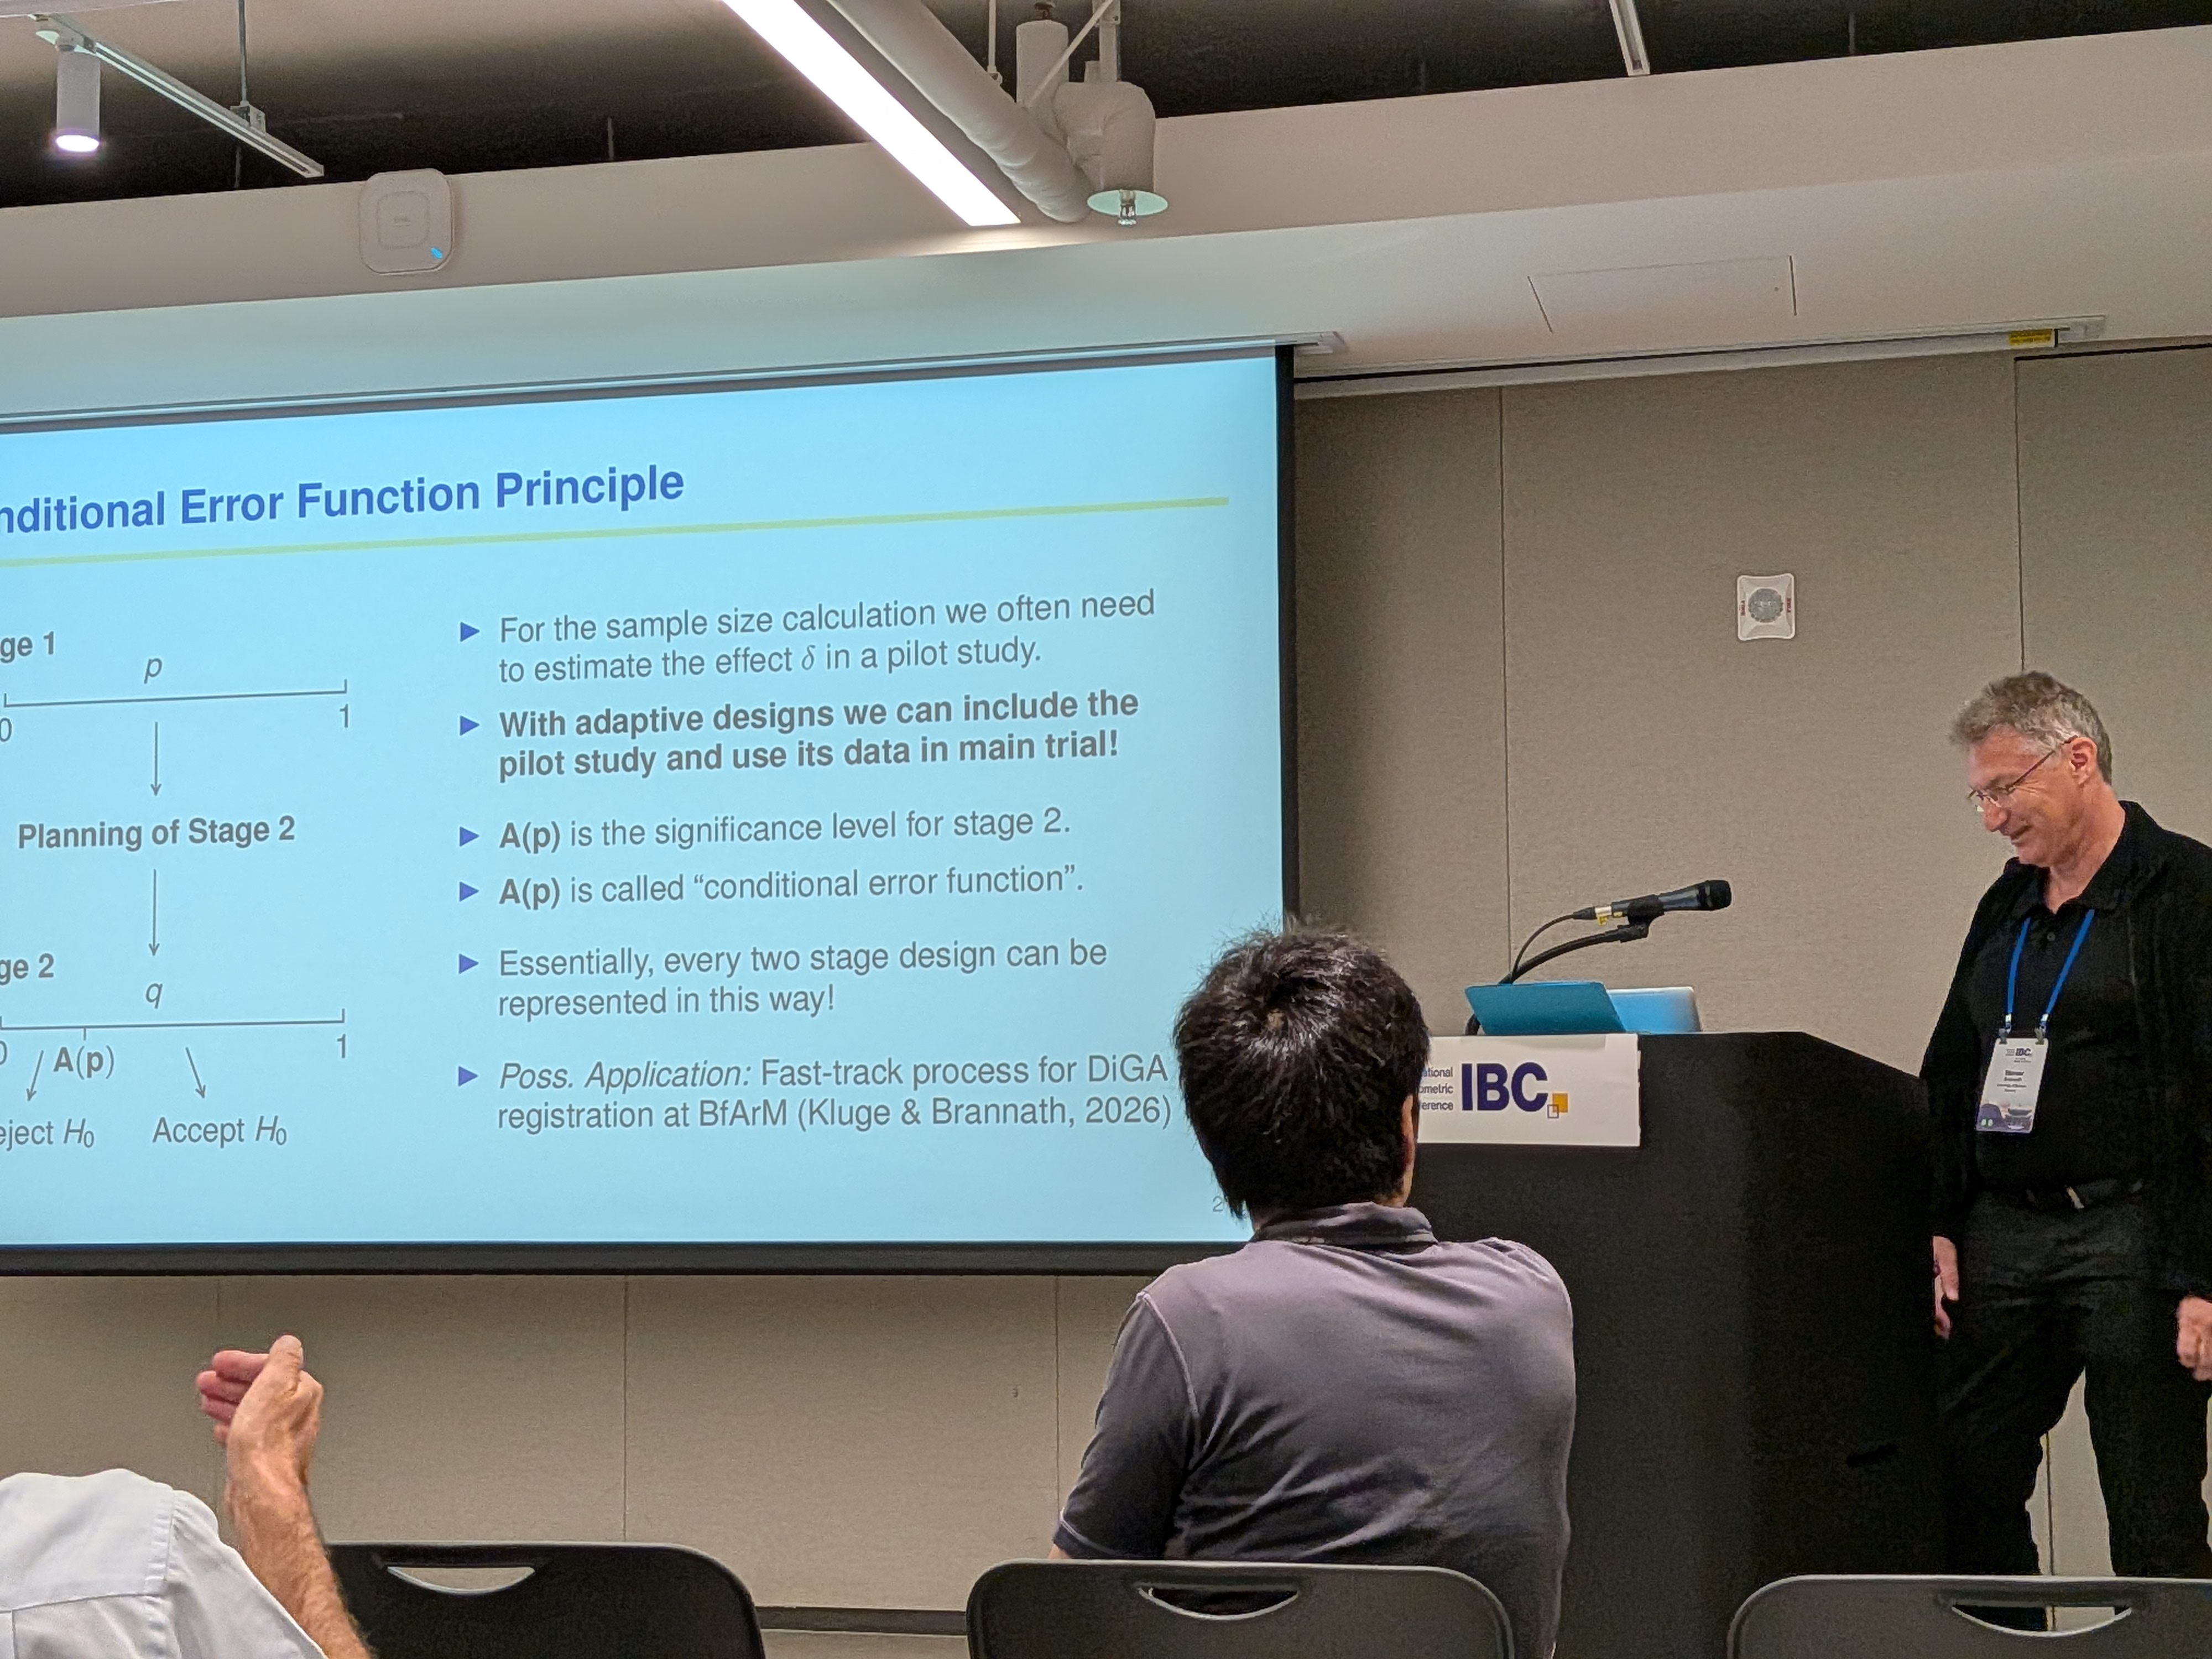
OP.01.05 Optimal conditional error functions for confirmatory adaptive designs (Werner Brannath, Universität Bremen)
Conditional error principle:
- Continue stage 2 with alpha equal to conditional error from stage 1.
- Conditional error function \(\nu(u)\) was central in the derivations.
- Weak conditions on estimator and p-value behavior were highlighted.
Optimization problem:
- Objective: minimize expected sample size.
- Constraints discussed:
- maintain type I error control
- conditional constraints linked to power/error behavior
- conditional error decreasing in first-stage p-value
- Nice: Analytic solutions are available!
Choice of stage-1 p-value density \(l(p)\):
- Optimizing for a fixed effect size is narrow.
- Prior-based effect distribution can be more robust.
- Maximum likelihood approach (take the maximum over positive effect sizes) is a good compromise.
Monotone/decreasing conditional error functions:
- Monotonicity is not guaranteed automatically.
- Optimal decreasing conditional error functions were presented.
- Implementation available in R package optconerrf
- Related prior work in adoptr was noted.
- Optional practical constraints can include max sample size and max conditional error.
- Overall this can be a nice alternative to the inverse normal method, because there you need larger max. sample sizes
OP.09 Monday 1:45-3:15 - Clinical Trial Methods, Applications and Software
OP.09.02 Designing Clinical Trials in R with rpact and crmPack (Daniel, RPACT)
You can find the whole slidedeck here!
OP.09.03 Aspirations Meet Reporting: Results from a Scoping Review of SMARTs from 2009-2024 (Nikki L.B. Freeman, Duke University)
- SMART: sequential multiple assignment randomized trials.
- Typical two-stage design; stage 1 resembles a standard RCT.
- Motivating goal: precision treatment sequencing over time.
- Dynamic treatment regimes are mainly analysis-level constructs.
- Scoping review details (as reported): prespecified, dual-reviewer process.
- Observed pattern:
- predominantly adult populations
- largely US-based studies
- concentration in behavioral and mental health
- typical sample size around 150
- few regulatory settings
- two randomizations common; more than two uncommon
- some cluster-randomized SMARTs
- many trials powered primarily for stage-1 comparisons
- Stronger reporting guidance for SMARTs is needed.
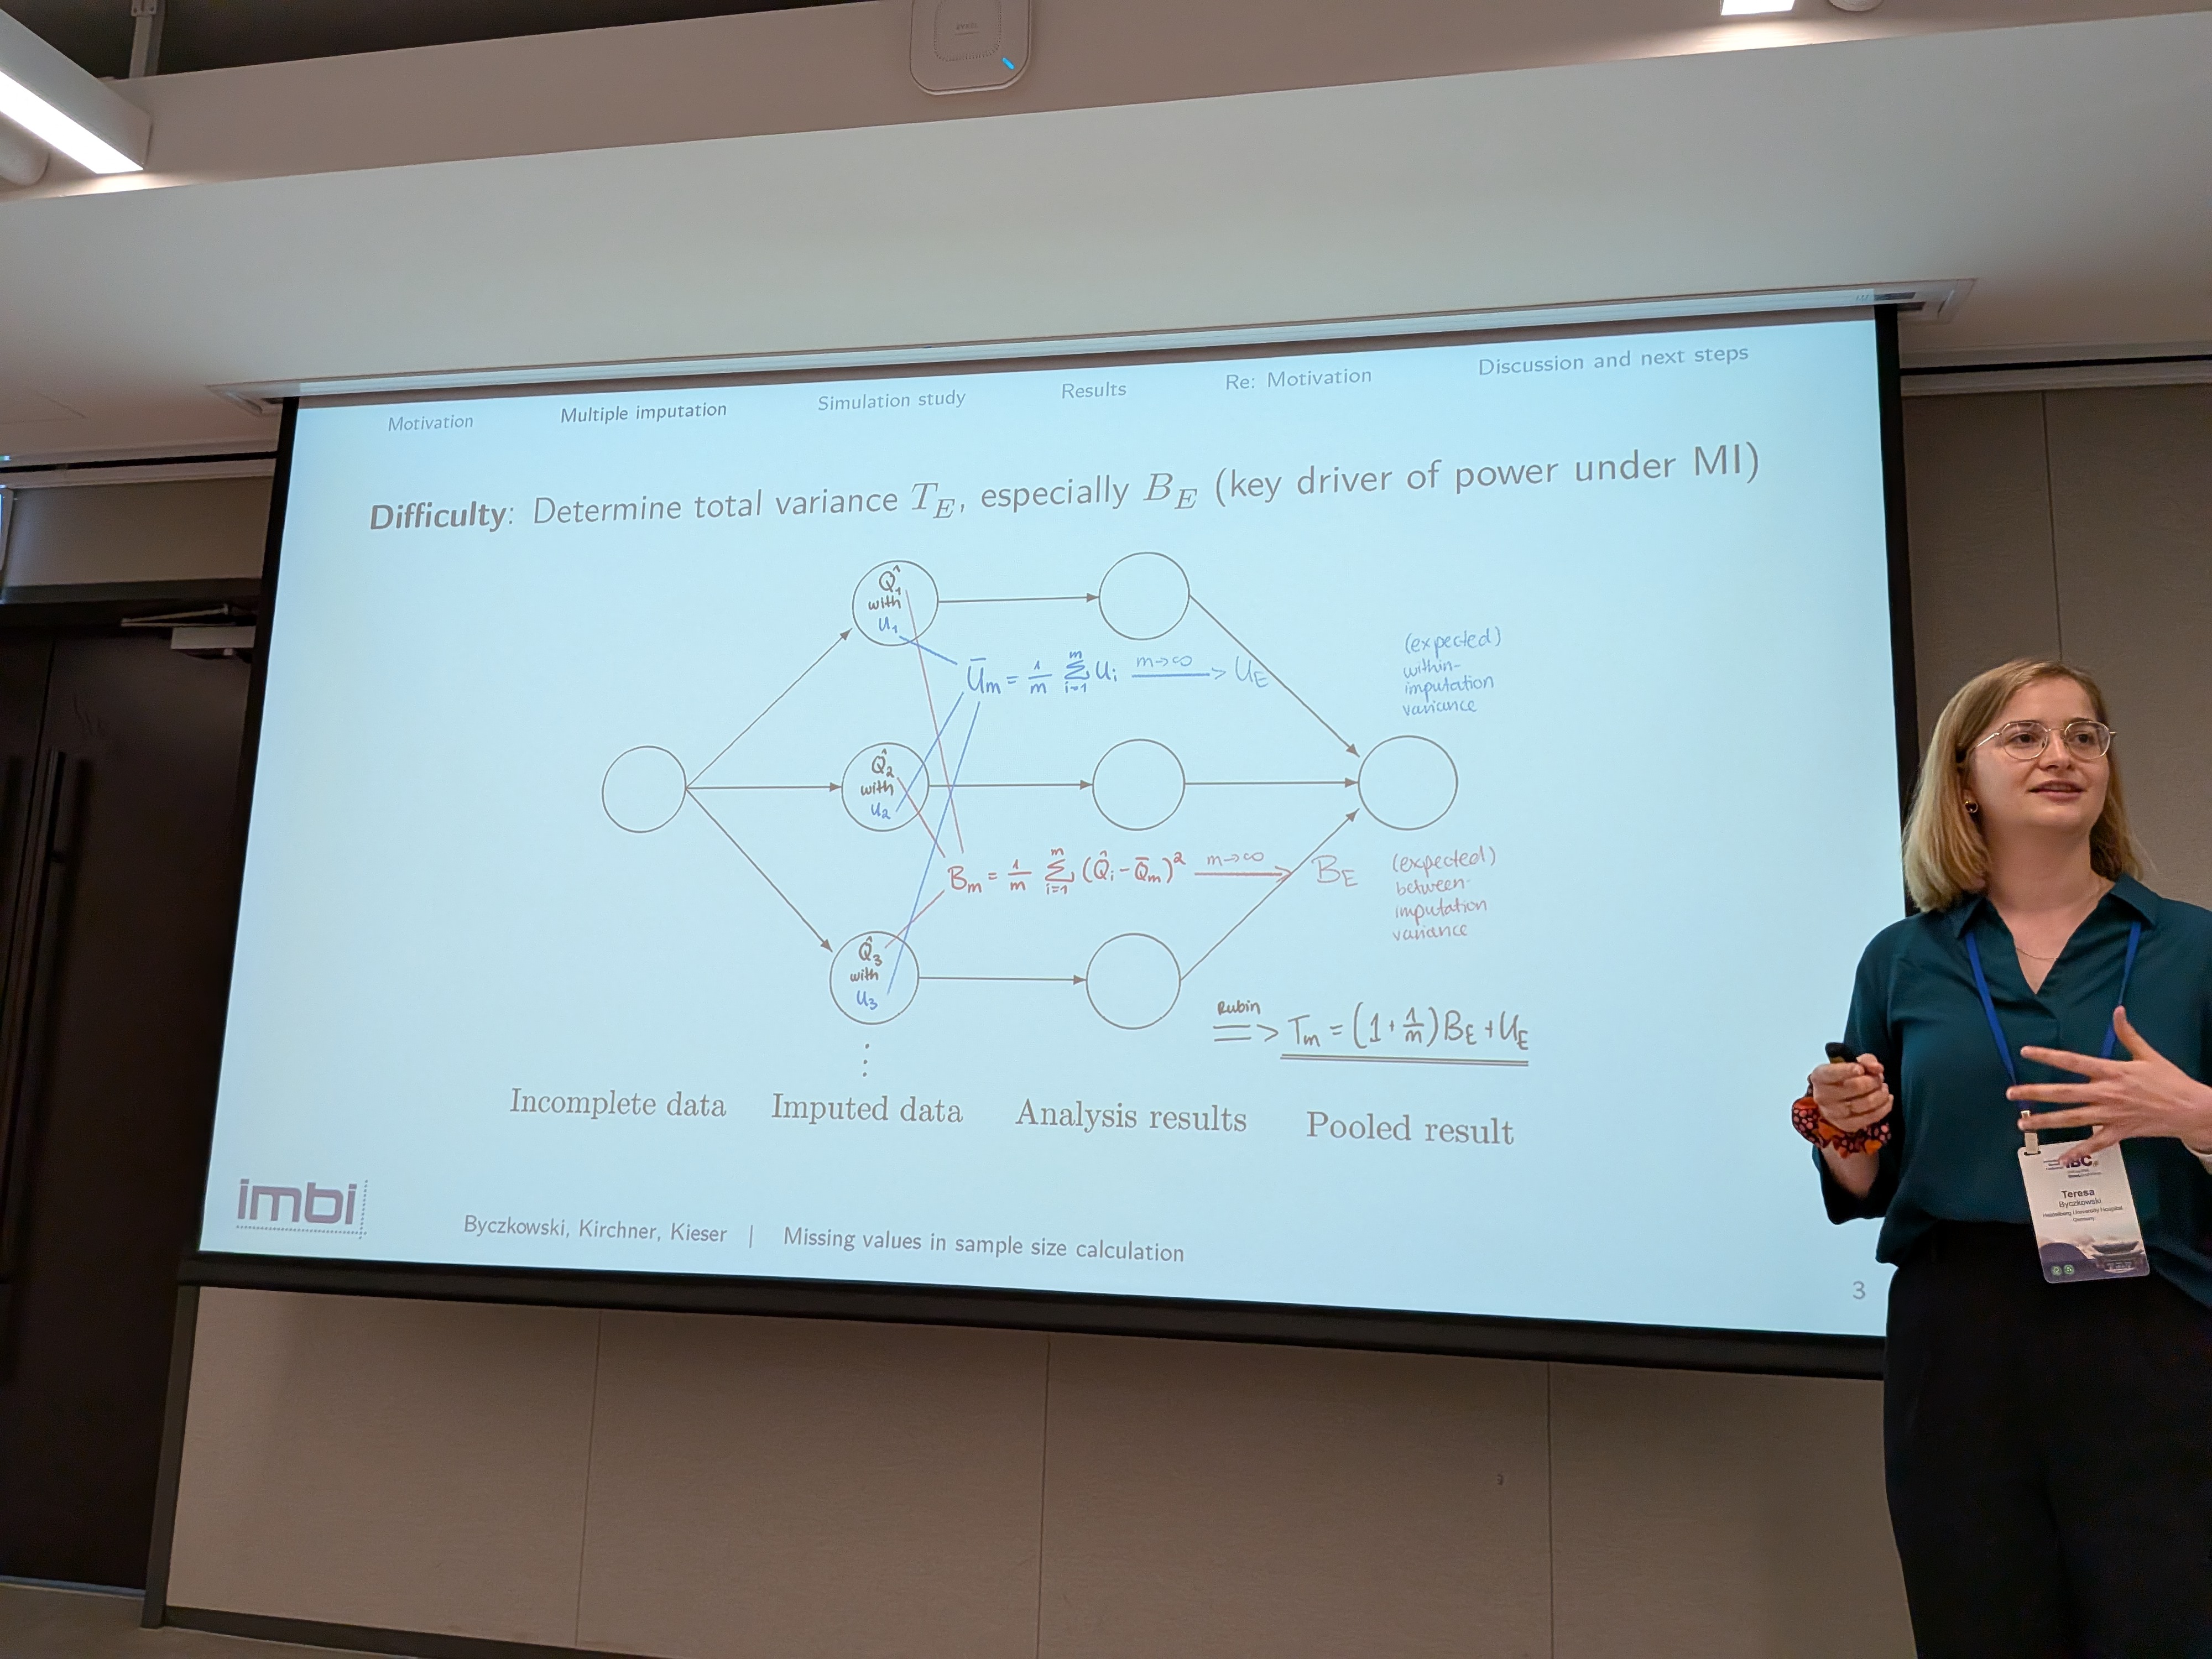
OP.09.04 Consideration of missing values in sample size calculation for clinical trials using multiple imputation (Teresa Byczkowski, Universität Heidelberg)
Talk-specific links: tmle package (related missing-data/targeted-learning discussion context from notes).
Main idea:
- Can sample size be reduced relative to complete-case plus dropout inflation, when final analysis uses multiple imputation (MI), which increases the power?
Prior work noted:
- Zha and Harel (2021) studied approximate power under MI. They used a normal linear regression model for their simulation study.
Simulation context:
- Normal linear regression setting.
- Continuous endpoints.
Results:
- MI can recover power versus complete-case analysis.
- Depends heavily on the assumed MAR mechanisms (MARTAIL, MARMID, MARRIGHT) (Buuren 2012).
- Extent of power increase depends mainly on the between imputation variance, which is unfortunately unknown in practice
Next steps noted:
- Explore MNAR assumptions.
- Use pilot study data to estimate the imputation variance.
OP.09.05 Constrained longitudinal analysis of repeated measurements in an RCT: How to handle subgroups (Stian Lydersen, Norwegian University of Science and Technology)
Core issue:
- How baseline values should be handled in repeated-measures analyses.
Motivation examples:
- Stensvold et al. (2020) study (older adults; exercise groups; measured VO2max):
- Question is whether the high intensity exercise group had a statistically significantly larger improvement in VO2max than the moderate intensity and control exercise groups.
- Available covariates are sex, age, cohabitation status, and baseline VO2max.
- Insomnia study with digital behavioral therapy and chronotype subgroups.
Methodological points:
- Constrained approach: no between-group baseline difference because of randomized arms (Coffman et al. 2016)
- Constrained longitudinal data analysis (cLDA) can be applied here.
- In discussed examples, longitudinal ANCOVA and CLDA results were similar.
- For subgroup effects, baseline constraints in MMRM were emphasized.
IS.20 Monday 15:30-17:00 - Methodological and Computational Advances in Joint Modeling of Longitudinal and Time-to-Event Data
IS.20.01 Posterior predictive checks for joint models (Dimitris Rizopoulos, Erasmus Medical Center)
Motivation:
- Information criteria (for example DIC) can lead to inconsistent model ranking.
Posterior predictive checks:
- Two-step Monte Carlo process: sample parameters, then sample observations.
- Posterior-posterior and posterior-prior variants:
- Depends where the random effect parameters are drawn from (posterior or prior).
- Dynamic checks using partial longitudinal history.
Goodness-of-fit diagnostics:
- Compare empirical CDF to posterior predictive CDF.
- Longitudinal residual diagnostics (including variogram-type views).
- Survival process checks via empirical survival distributions.
- Joint concordance diagnostics for survival-longitudinal coherence (use the version that can account for censoring!)
Software note: available in JMbayes2 with vignette support.
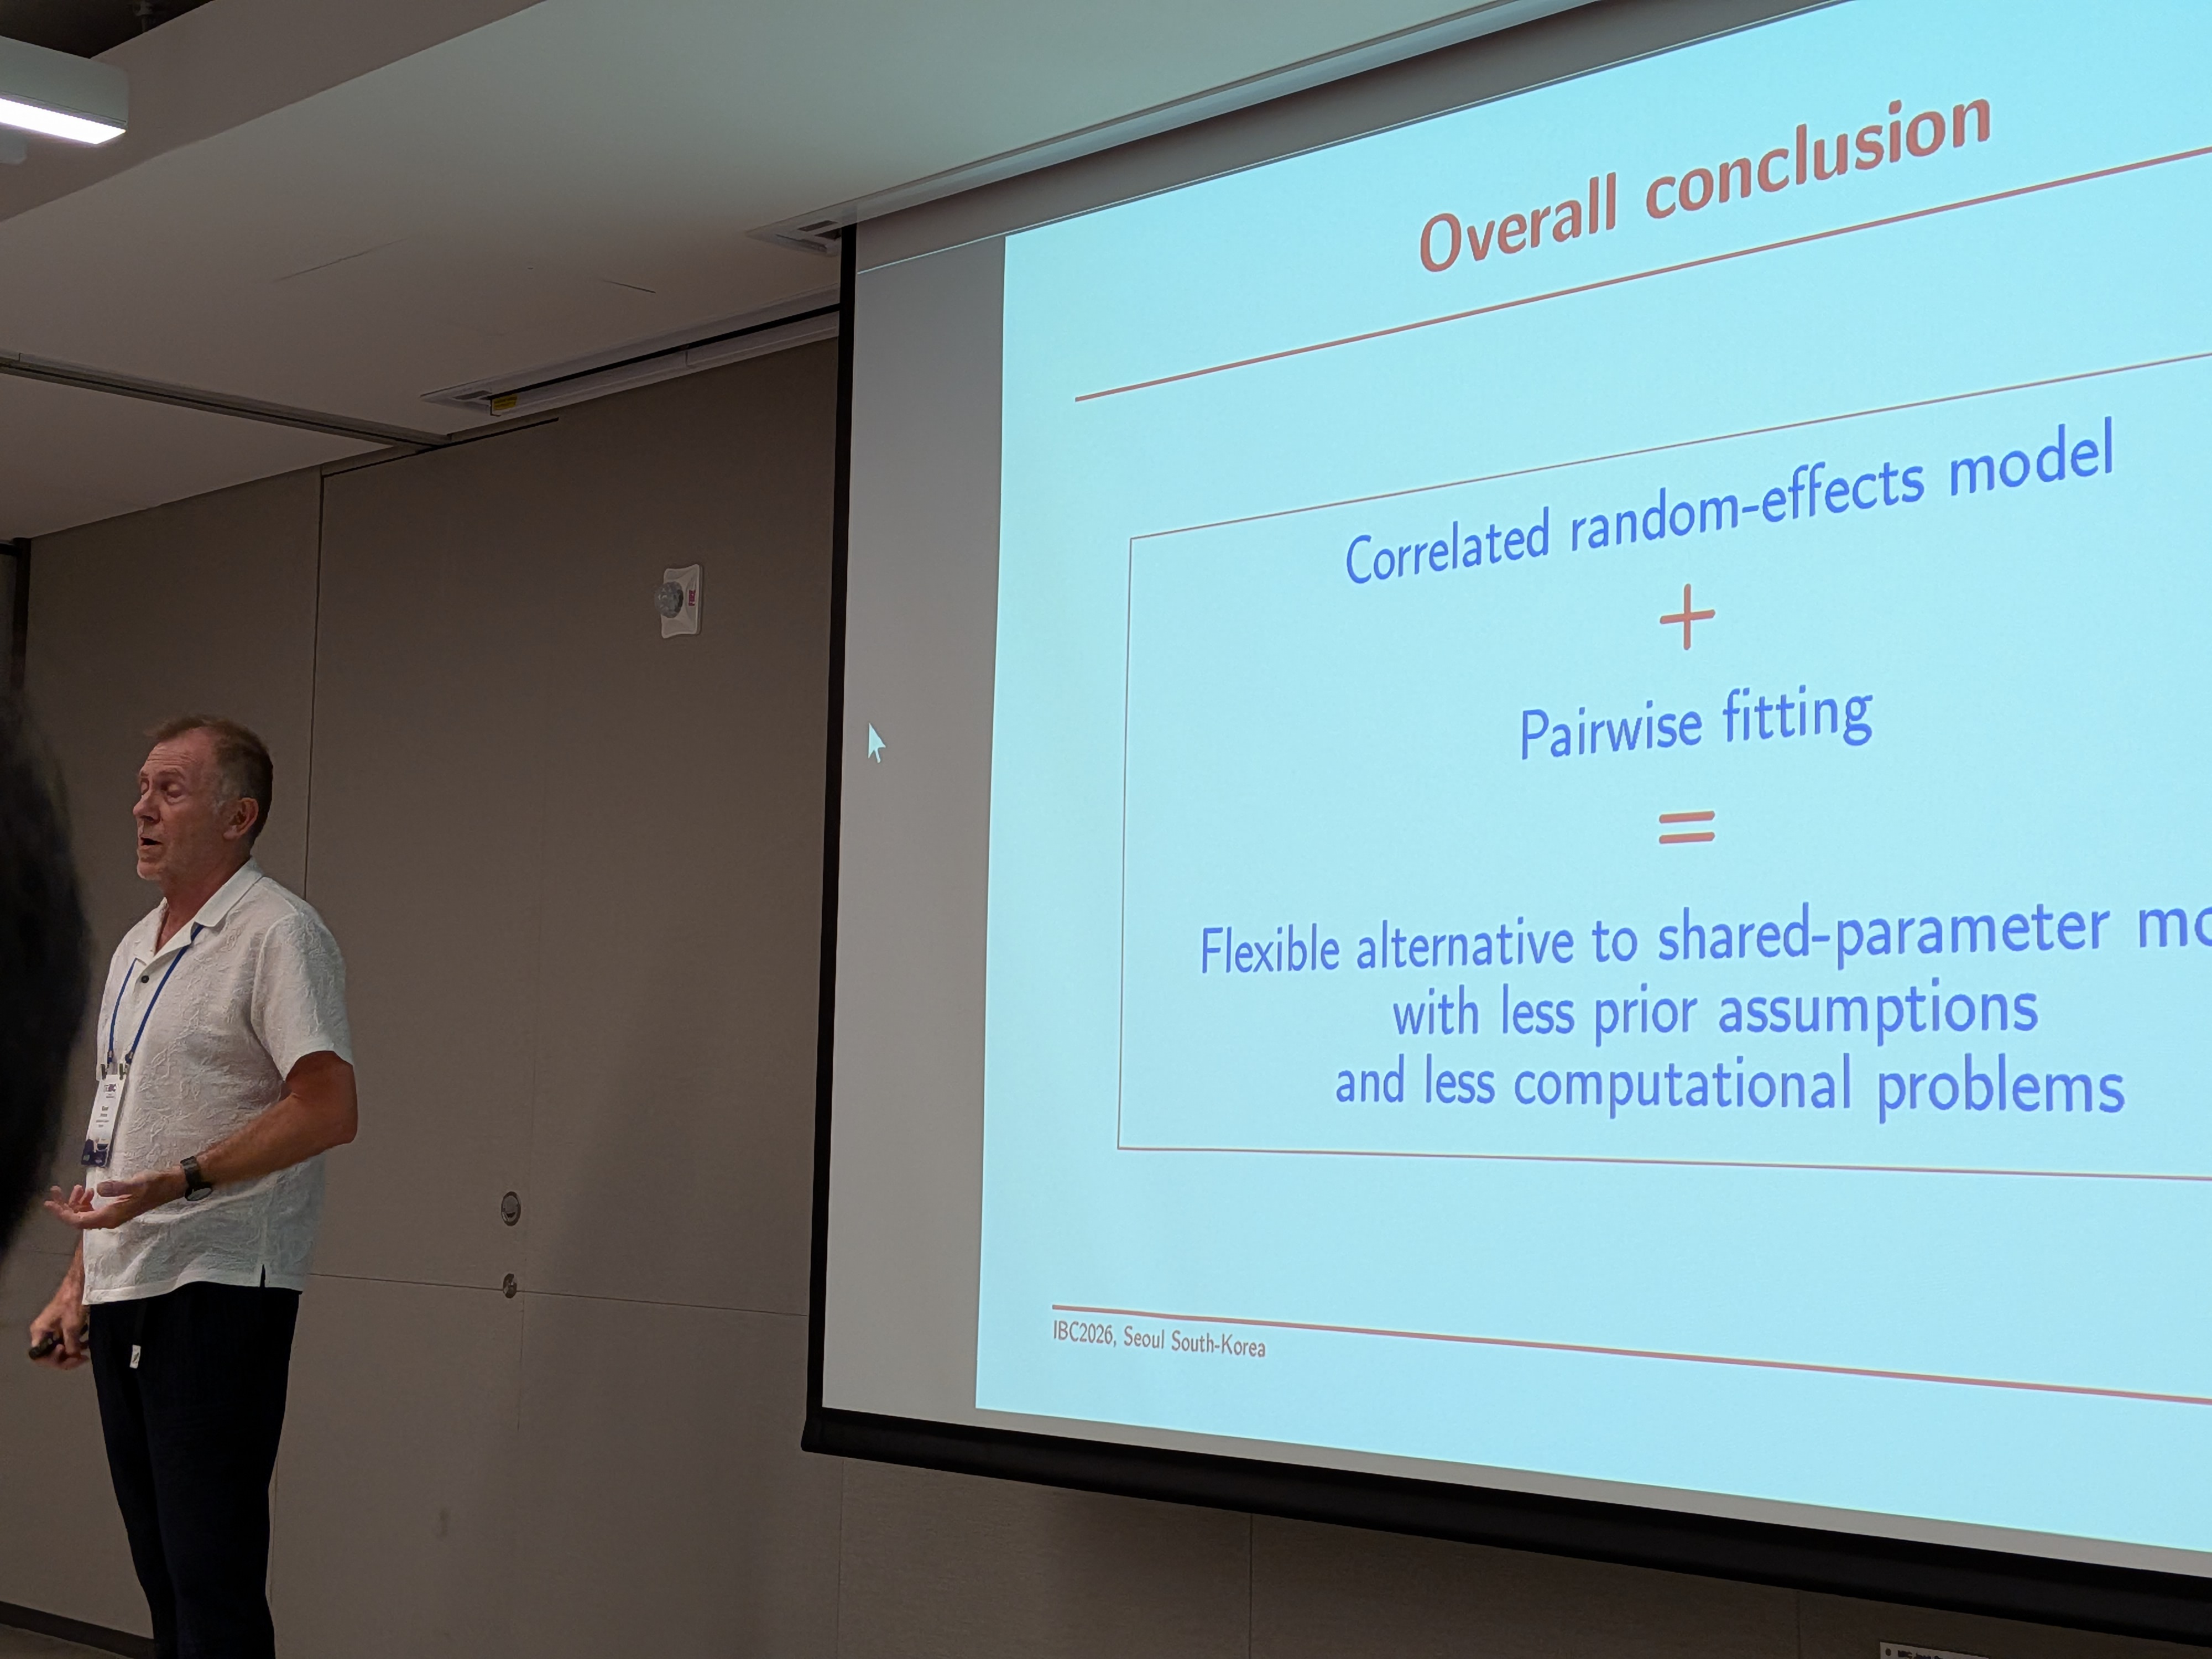
IS.20.02 Fast and efficient fitting of joint models (Geert Verbeke, KU Leuven)
Setting:
- Multiple mixed-type longitudinal outcomes plus one survival endpoint.
Key idea:
- Alternative frailty/shared-parameter parameterization enabling decomposition and pairwise-parallel fitting.
Advantages discussed:
- Pairwise (RE)ML fitting for scalability.
- Averaging of duplicated parameter estimates across fitted components.
- Conditional normality argument for frailty representation with additional error term.
Examples:
- IPF example with 20 biomarkers + survival (high-dimensional random effects).
- joineRML package does not converge here
- PBC example with random intercept/slope structure.
Limitations:
- Pseudo-likelihood inference rather than full likelihood.
- Potential bias under informative dropout after event occurrence.
IS.20.03 End-stage kidney disease (ESKD) (Esra Kurum, UC Riverside)
Context:
- High mortality (55% within 3 years) and recurrent hospitalization burden.
- Large United States Renal Data System (USRDS) registry data with strong regional heterogeneity.
Approach:
- Shared-parameter style joint modeling.
- Generalized varying-coefficient model for hospitalization rate.
- Time-varying coefficients to capture evolving dynamics.
- Two-stage iterative estimation for large-scale computation:
- Parallel region-level estimation with global parameters fixed
- Global estimation over subsets with region parameters fixed
- Iterating between both steps until convergence.
Result:
- Computational scaling benefit increased with number of regions.
- Persistent regional differences estimated after case-mix adjustment.
IS.20.04 Simultaneous variable selection in joint models (Rajeshwari Sundaram, National Institutes of Health)
Application:
- Fecundity/time-to-pregnancy with menstrual cycle length dynamics and correlated chemical exposures.
- Menstrual cycle lengths (MCL) are associated with longer TTP
- Couple’s exposure to chemicals is highly correlated (like with other pollution, too)
Modeling components:
- Discrete survival models for TTP (discrete Cox model, proportional hazards model with complementary log-log link).
- Longitudinal models for MCL.
- Penalization families: elastic net, grouped lasso, adaptive grouped lasso, Group smoothly clipped adaptive deviation (SCAD), Minimax convex penalty (MCP).
Estimation:
- Monte-Carlo Estimation Maximization (MCEM) algorithm
Reported behavior:
- Similar performance across penalties for longitudinal part.
- Harder bias control in survival component.
Next steps:
- Non-linear effects of chemicals
- Use mixture of normal with Gumbel to get a better fit
IS.05 Tuesday 9:00-10:30 - Bayesian spatial and spatio-temporal modeling for public health
IS.05.02 Modeling bounded well-being indices using Bayesian double generalized Beta regression with spatial and temporal borrowing (Shariq Mohammed, Boston University)
Data:
- Massachusetts Sharecare Well-Being Index (WBI, 0-100 bounded outcome).
- Zip code tagged areas (ZCTA) level structure changing over time.
- Individual covariates (sex, age, race, marital status, education, income) plus area-level features.
Objective:
- Model bounded outcome and estimate mean/variance by area/time on ZCTA level.
- Borrow strength for sparse/no-response ZCTAs.
Methods:
- Beta regression with mean/precision parameterization.
- For the mean use individual covariates, for the precision use ZCTA covariates
- Spatial random effects via graph Laplacian.
- Neighborhood definition by driving time threshold (30 min).
- Temporal borrowing via prior centering on prior-year means.
- Stan implementation; average marginal effects on original scale.
- Compute average marginal effects = difference of two expected WBIs
Results:
- Positive spatial effects in specific regions (for example Cape Cod and western Boston).
- Greater within-area homogeneity in more mixed ZCTAs.
- Open source mentioned: BayesBadger.
- Runtime challenge: annual fit roughly 1-2 days in Stan.
Next steps:
- Explore faster approximations incl. INLA for national data analysis.
IS.05.03 Estimating parish-specific force of infection (FOI) using a Bayesian hierarchical spatial model (Lynn Gao, UC Irvine)
Background:
- Force of infection (FOI) as per-capita infection hazard.
- Complements other metrics incl. the reproduction number R0.
- Classical catalytic models (Shkedy et al. 2003) can miss spatial structure.
Objective:
- Age- and space-varying FOI estimation.
- Association between FOI and urbanicity.
Methods:
- Use a 2-stage Bayesian hierarchical model.
- Poisson case model depending on FOI parameter.
- Model FOI with intercepts for age category and space
- Spatial effects with CAR/BYM/BYM2-type structures (Riebler et al. 2016)
- Modified BYM2 variant used in final analysis (Michal et al. 2025)
Result:
- No clear FOI-urbanicity relationship in presented findings.
OP.33 Tuesday 10:45-12:15 - Dose Finding Methods
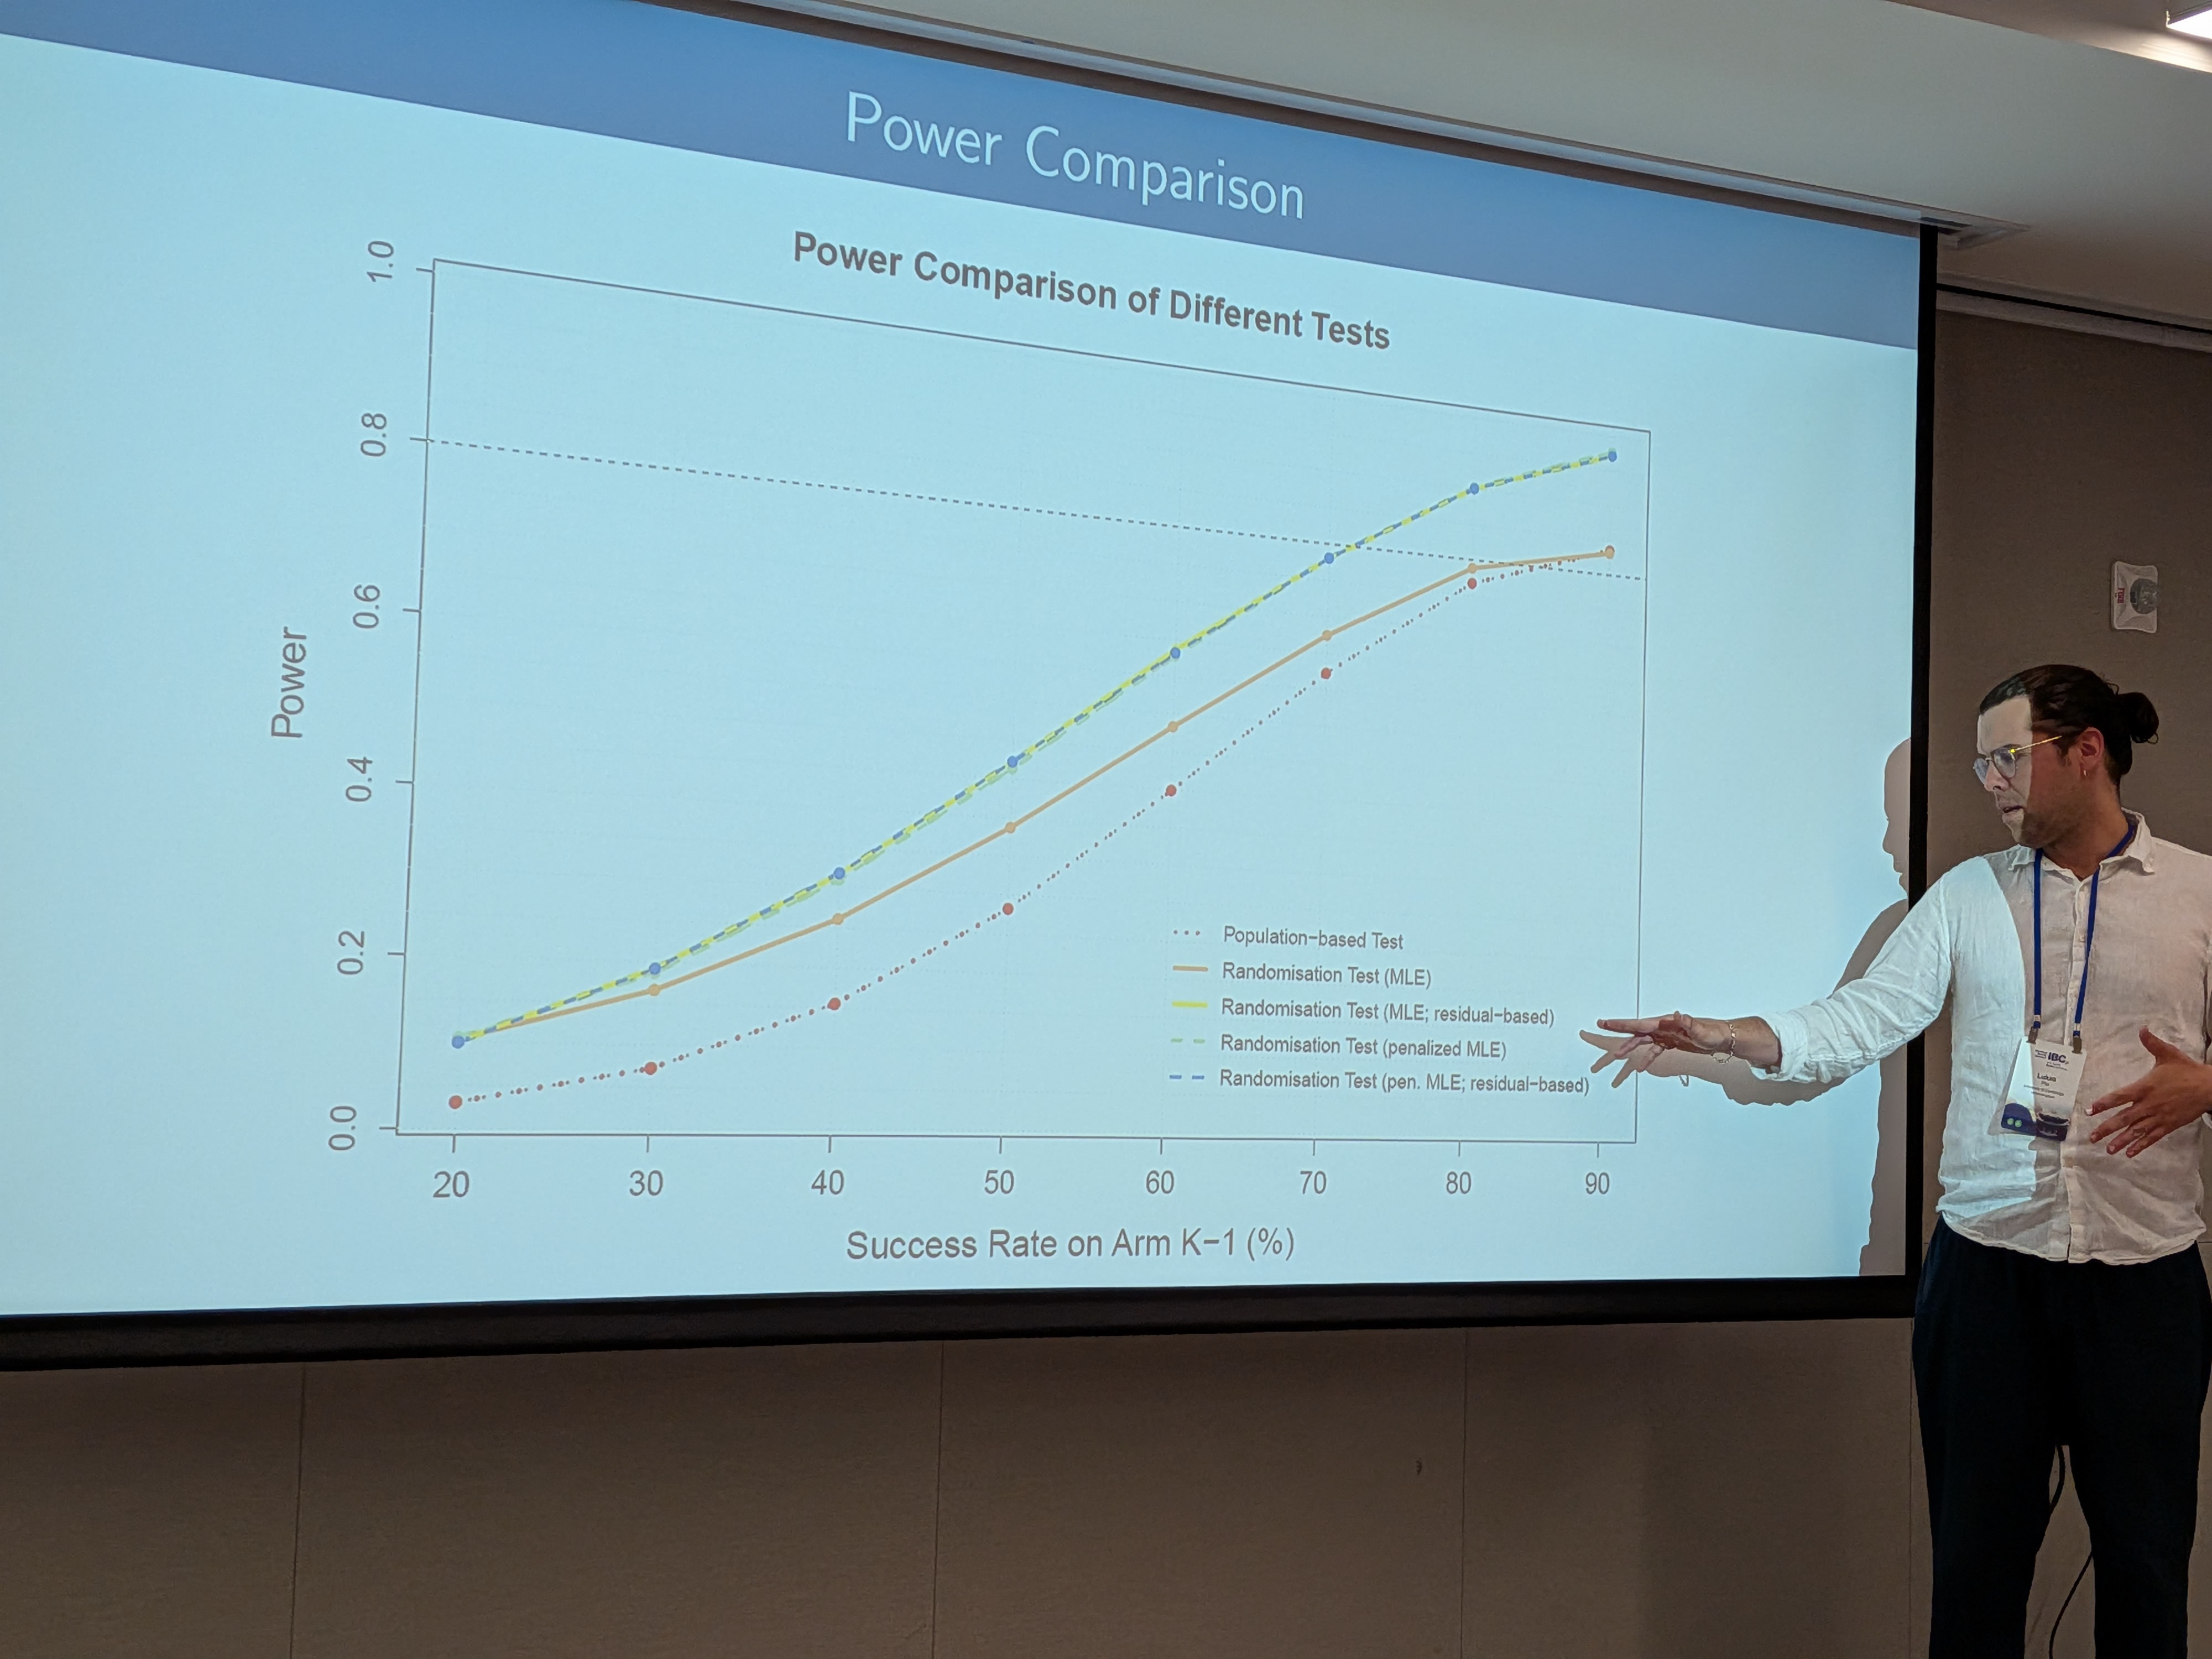
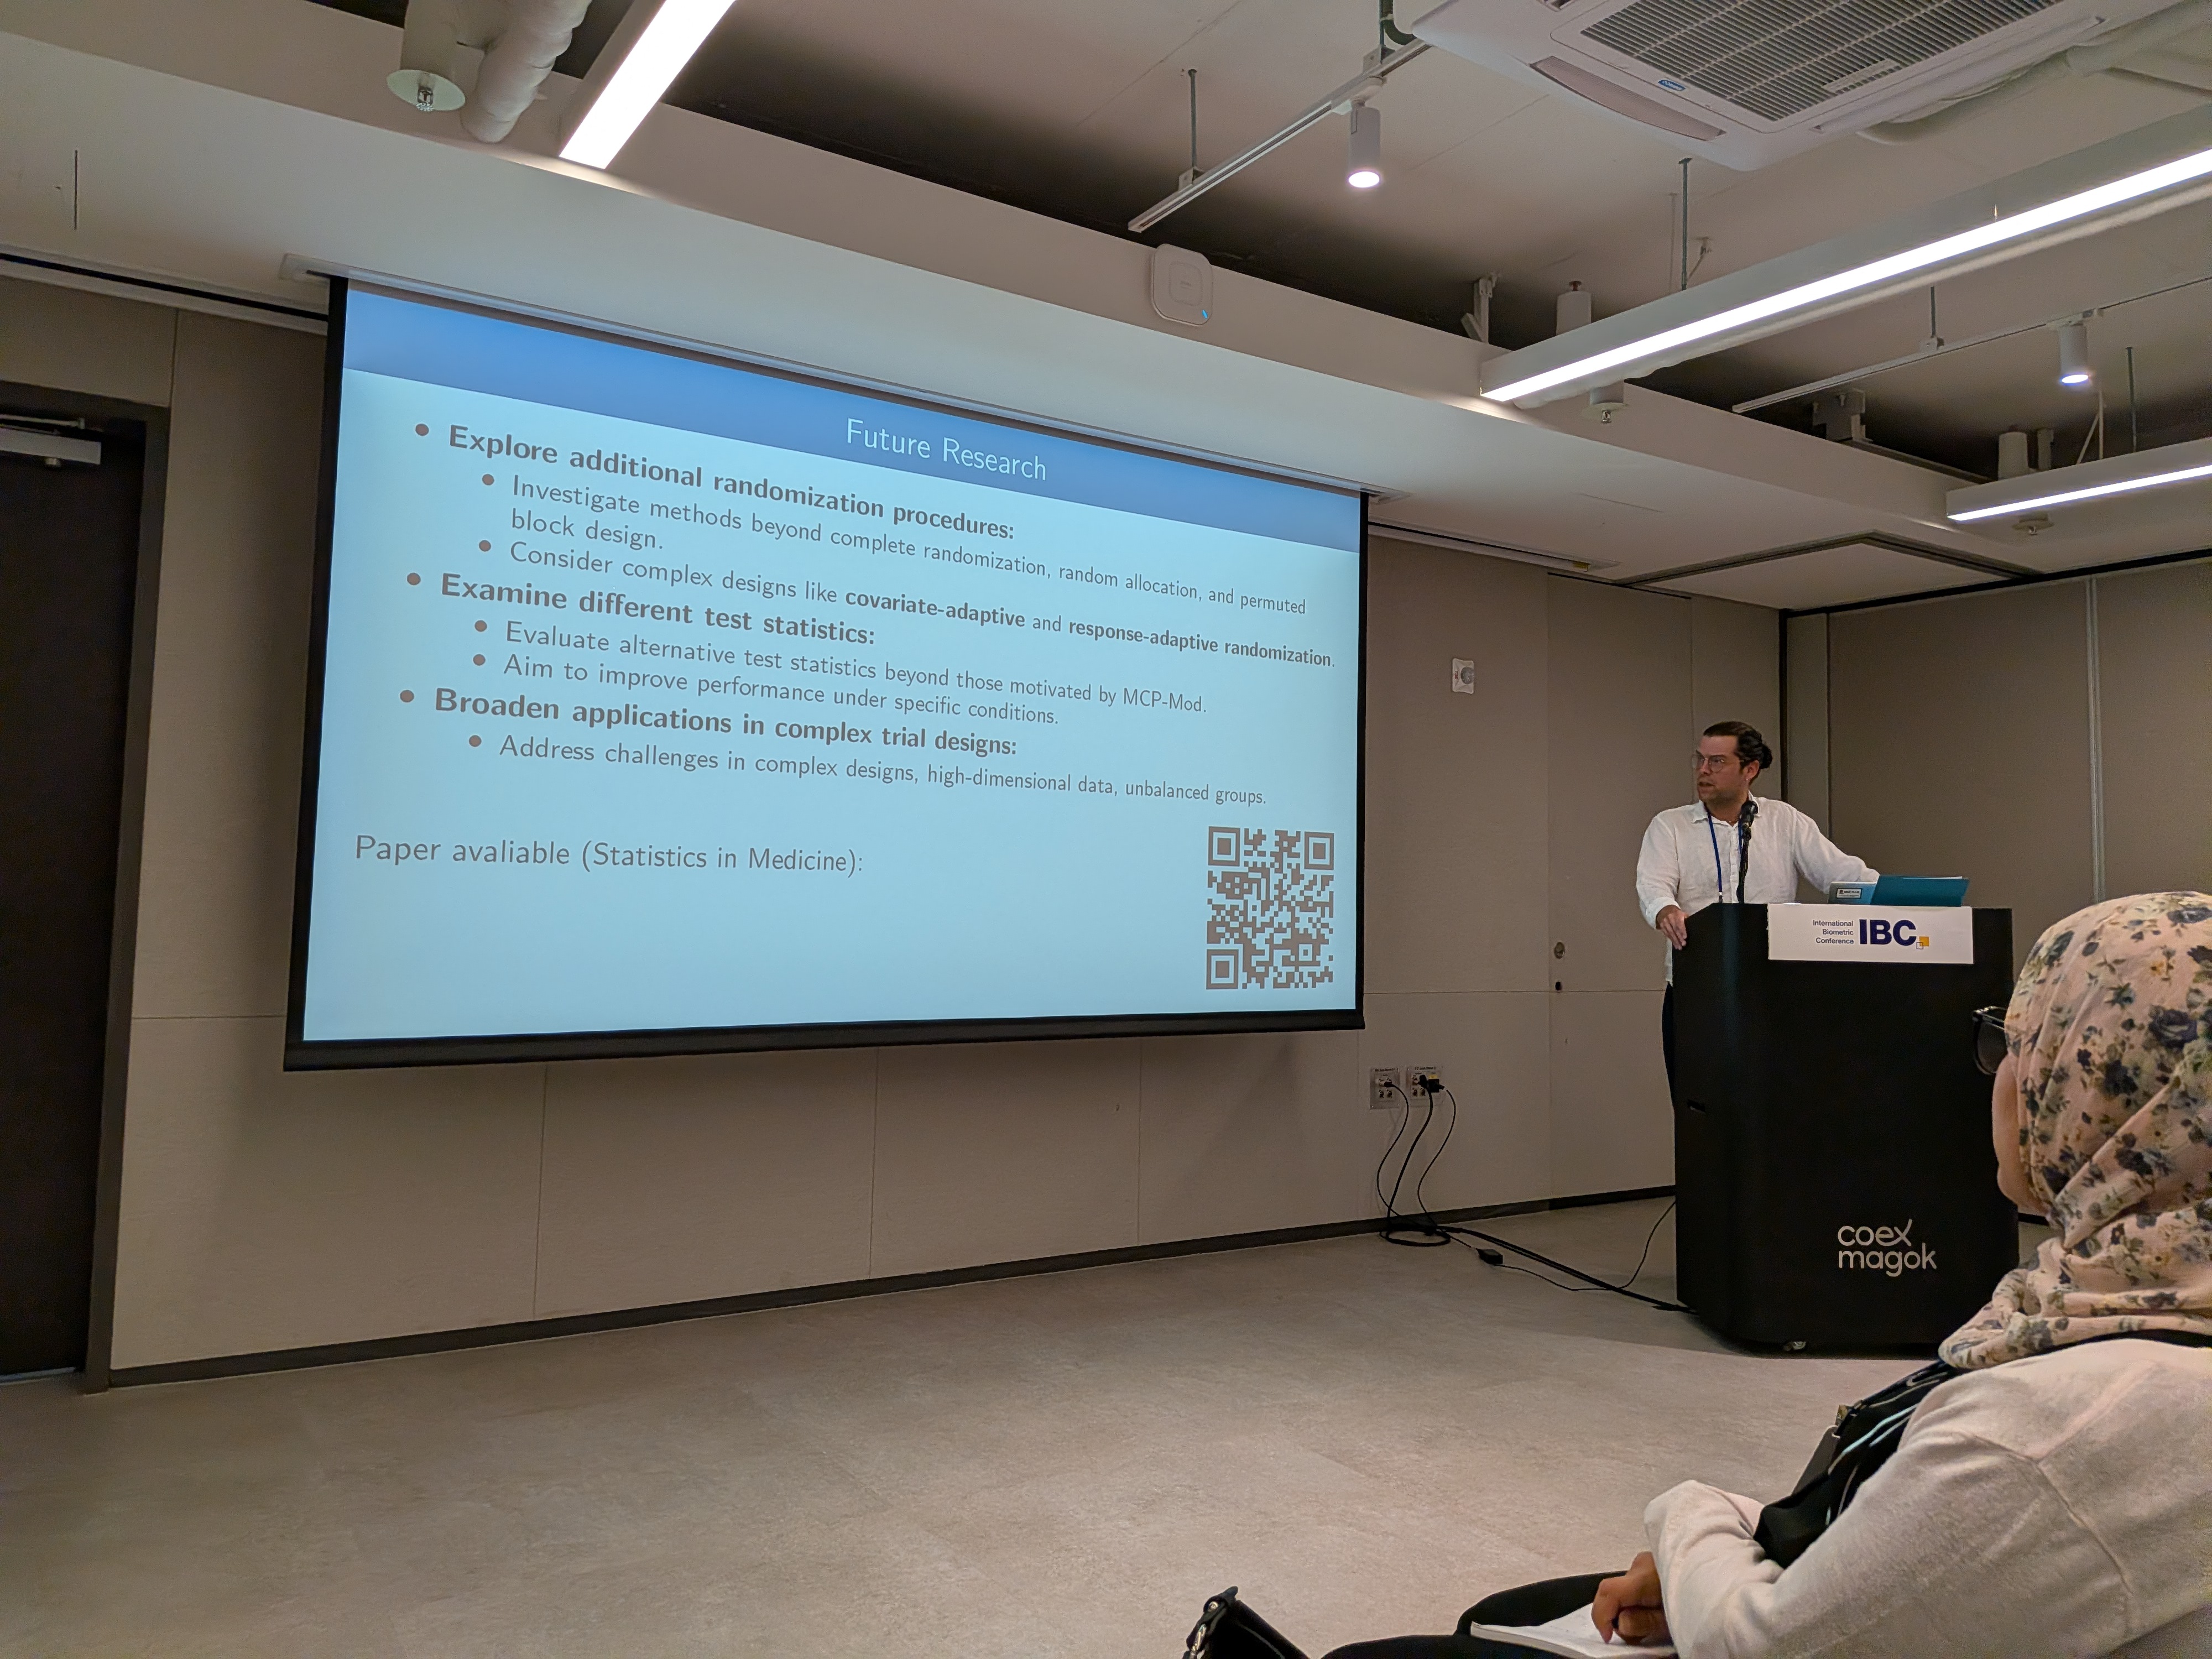
OP.33.02 Randomization-Based Inference for MCP-Mod (Lukas Pin, Cambridge)
Motivation:
- Small (n=49) phase II binary trial setting with 3 active dose arms and placebo.
- 5 candidate models incl. non-monotone beta shape.
- Logistic complete separation challenge, one solution is to use Firth regression e.g. implemented in the logistf package
Method:
- Contrast model-based super-population inference with finite-sample randomization inference.
- Generalized MCP-Mod statistic and residual-based alternative.
- Monte Carlo randomization p-value computation.
- See Pin et al. (2025) for details.
Results:
- In small samples, randomization-based approach gave higher power under exact type I error control.
- Residual-based computation (“Praha trick”) provided substantial speed-up.
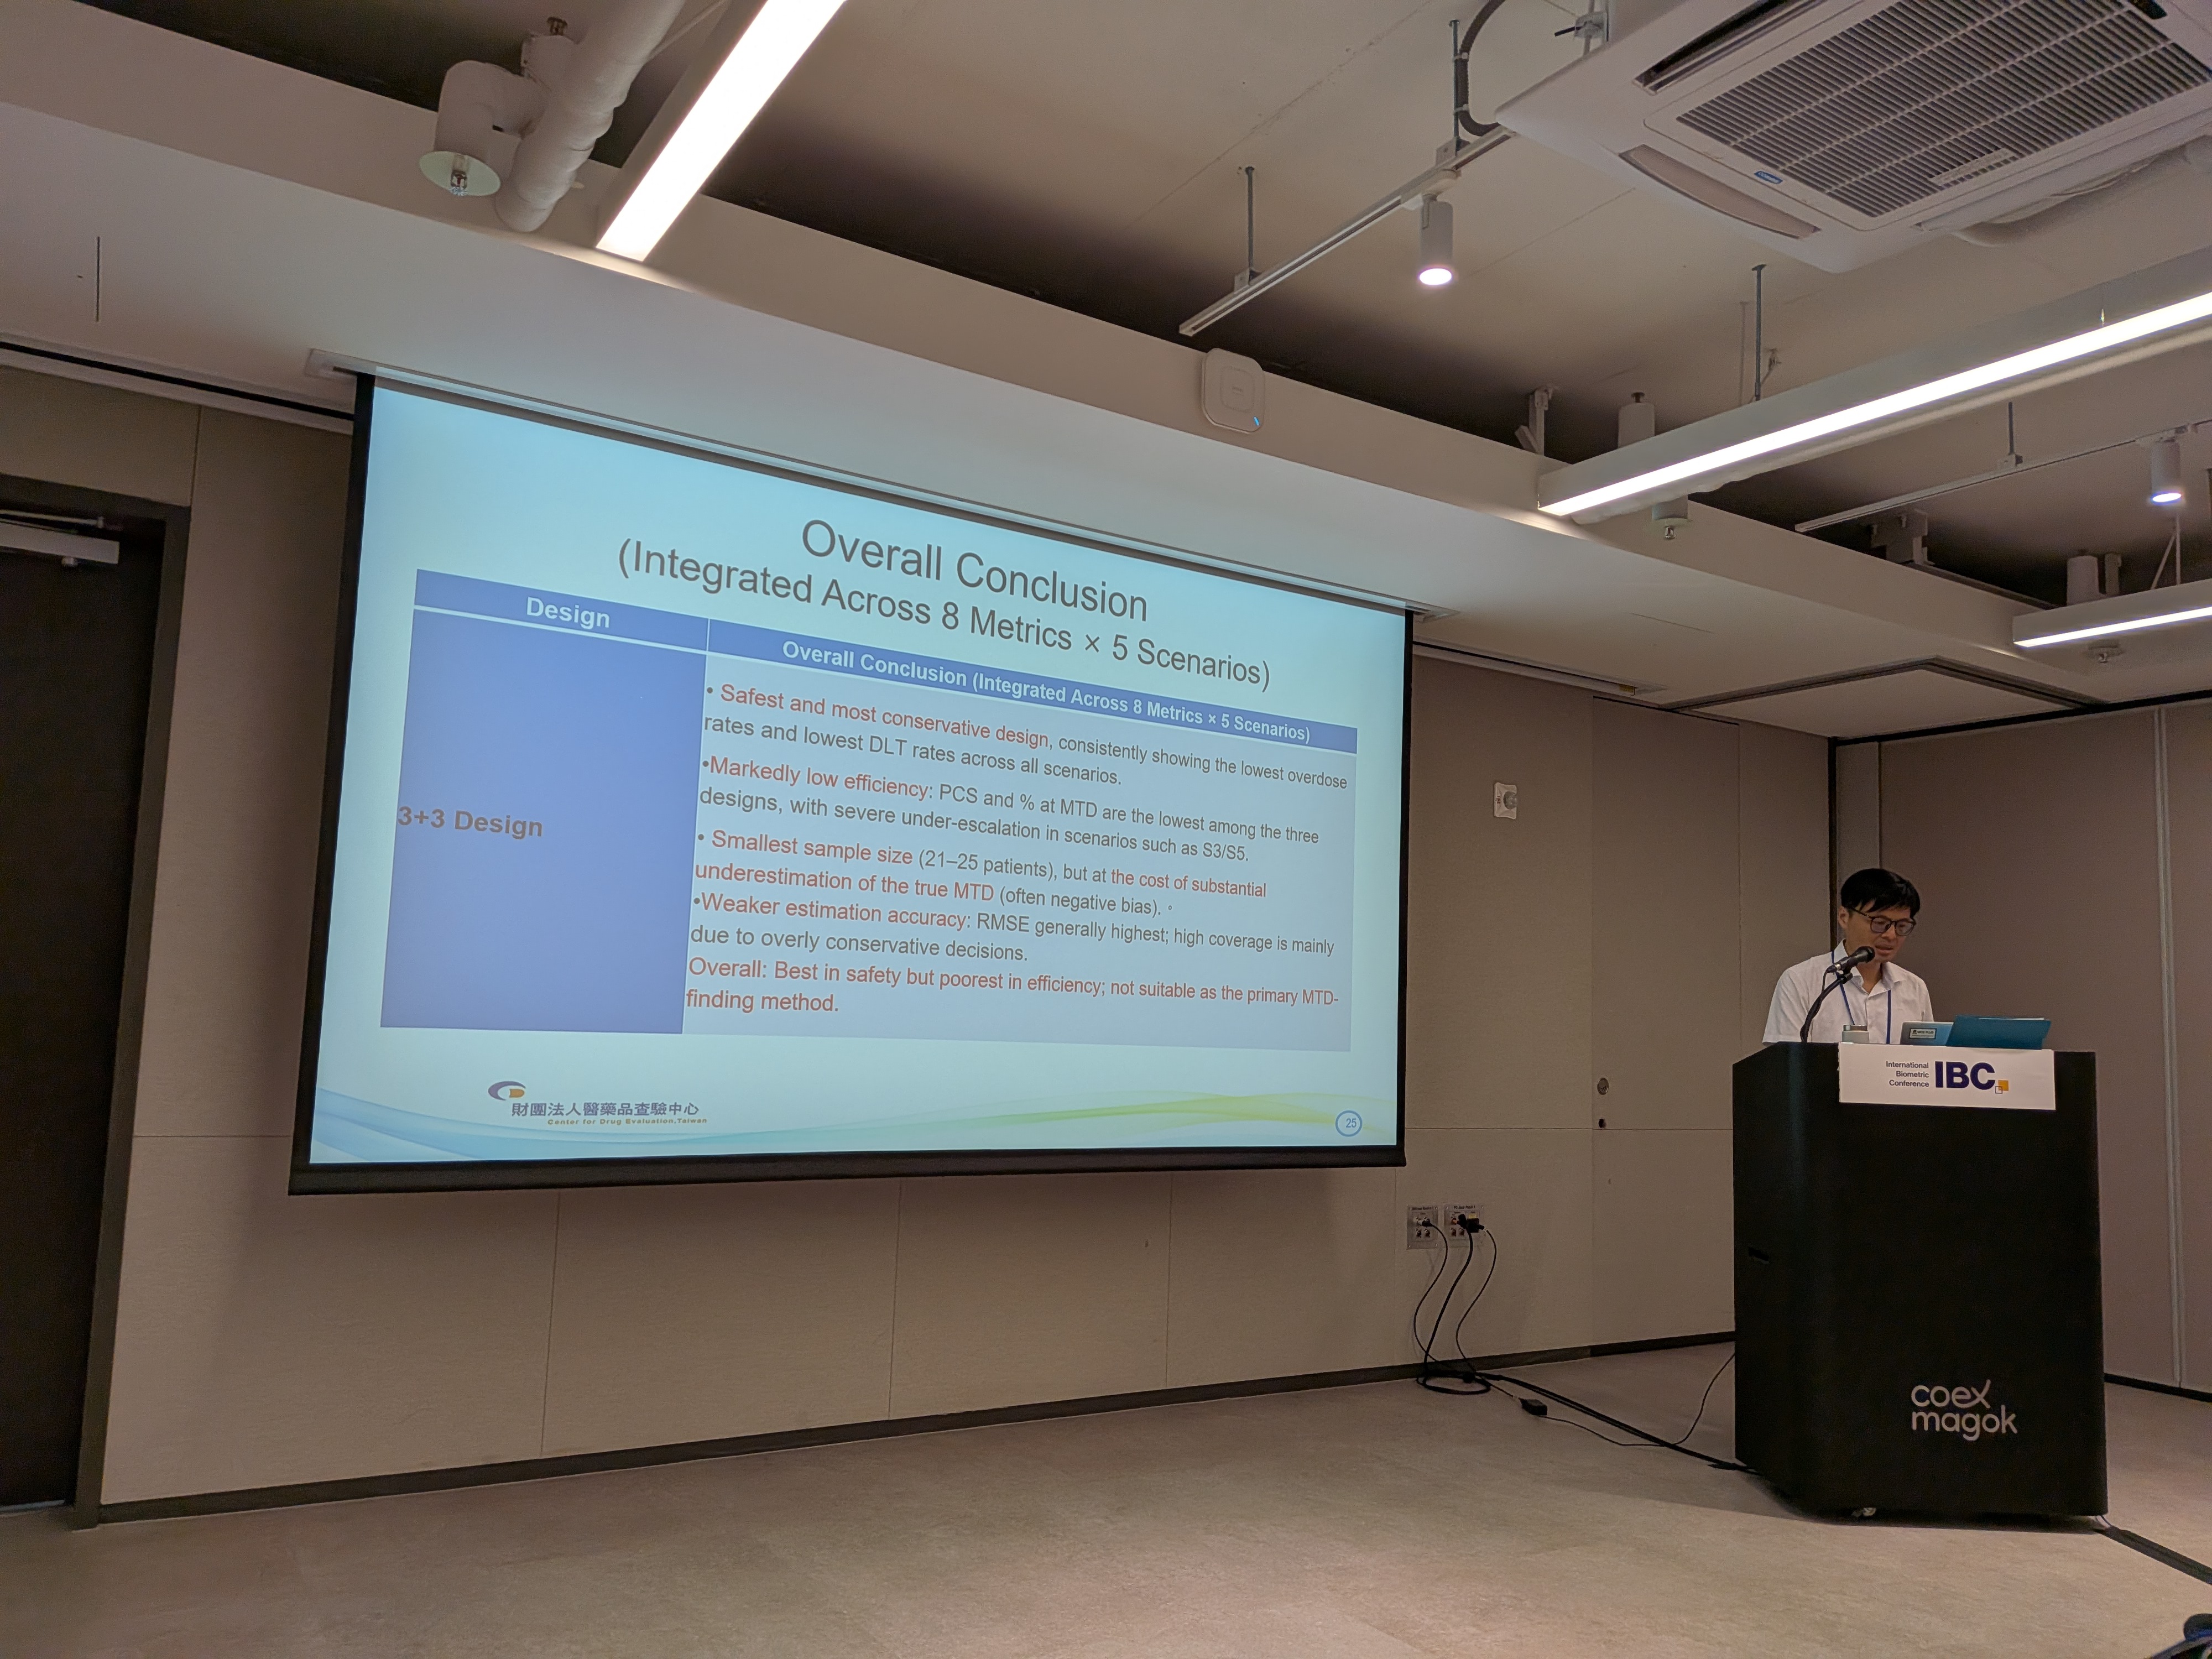
OP.33.03 Statistical Methods and Regulatory Considerations in Phase I Clinical Trials (林資荃,Tzu-Chuan Lin, Taiwan regulator)
- Reviewed DLT concepts and phase I principles.
- Compared rule-based, model-based, and model-assisted escalation designs.
- Simulation settings included multiple scenarios and seven dose levels.
- Communication with clinicians identified as a practical bottleneck.
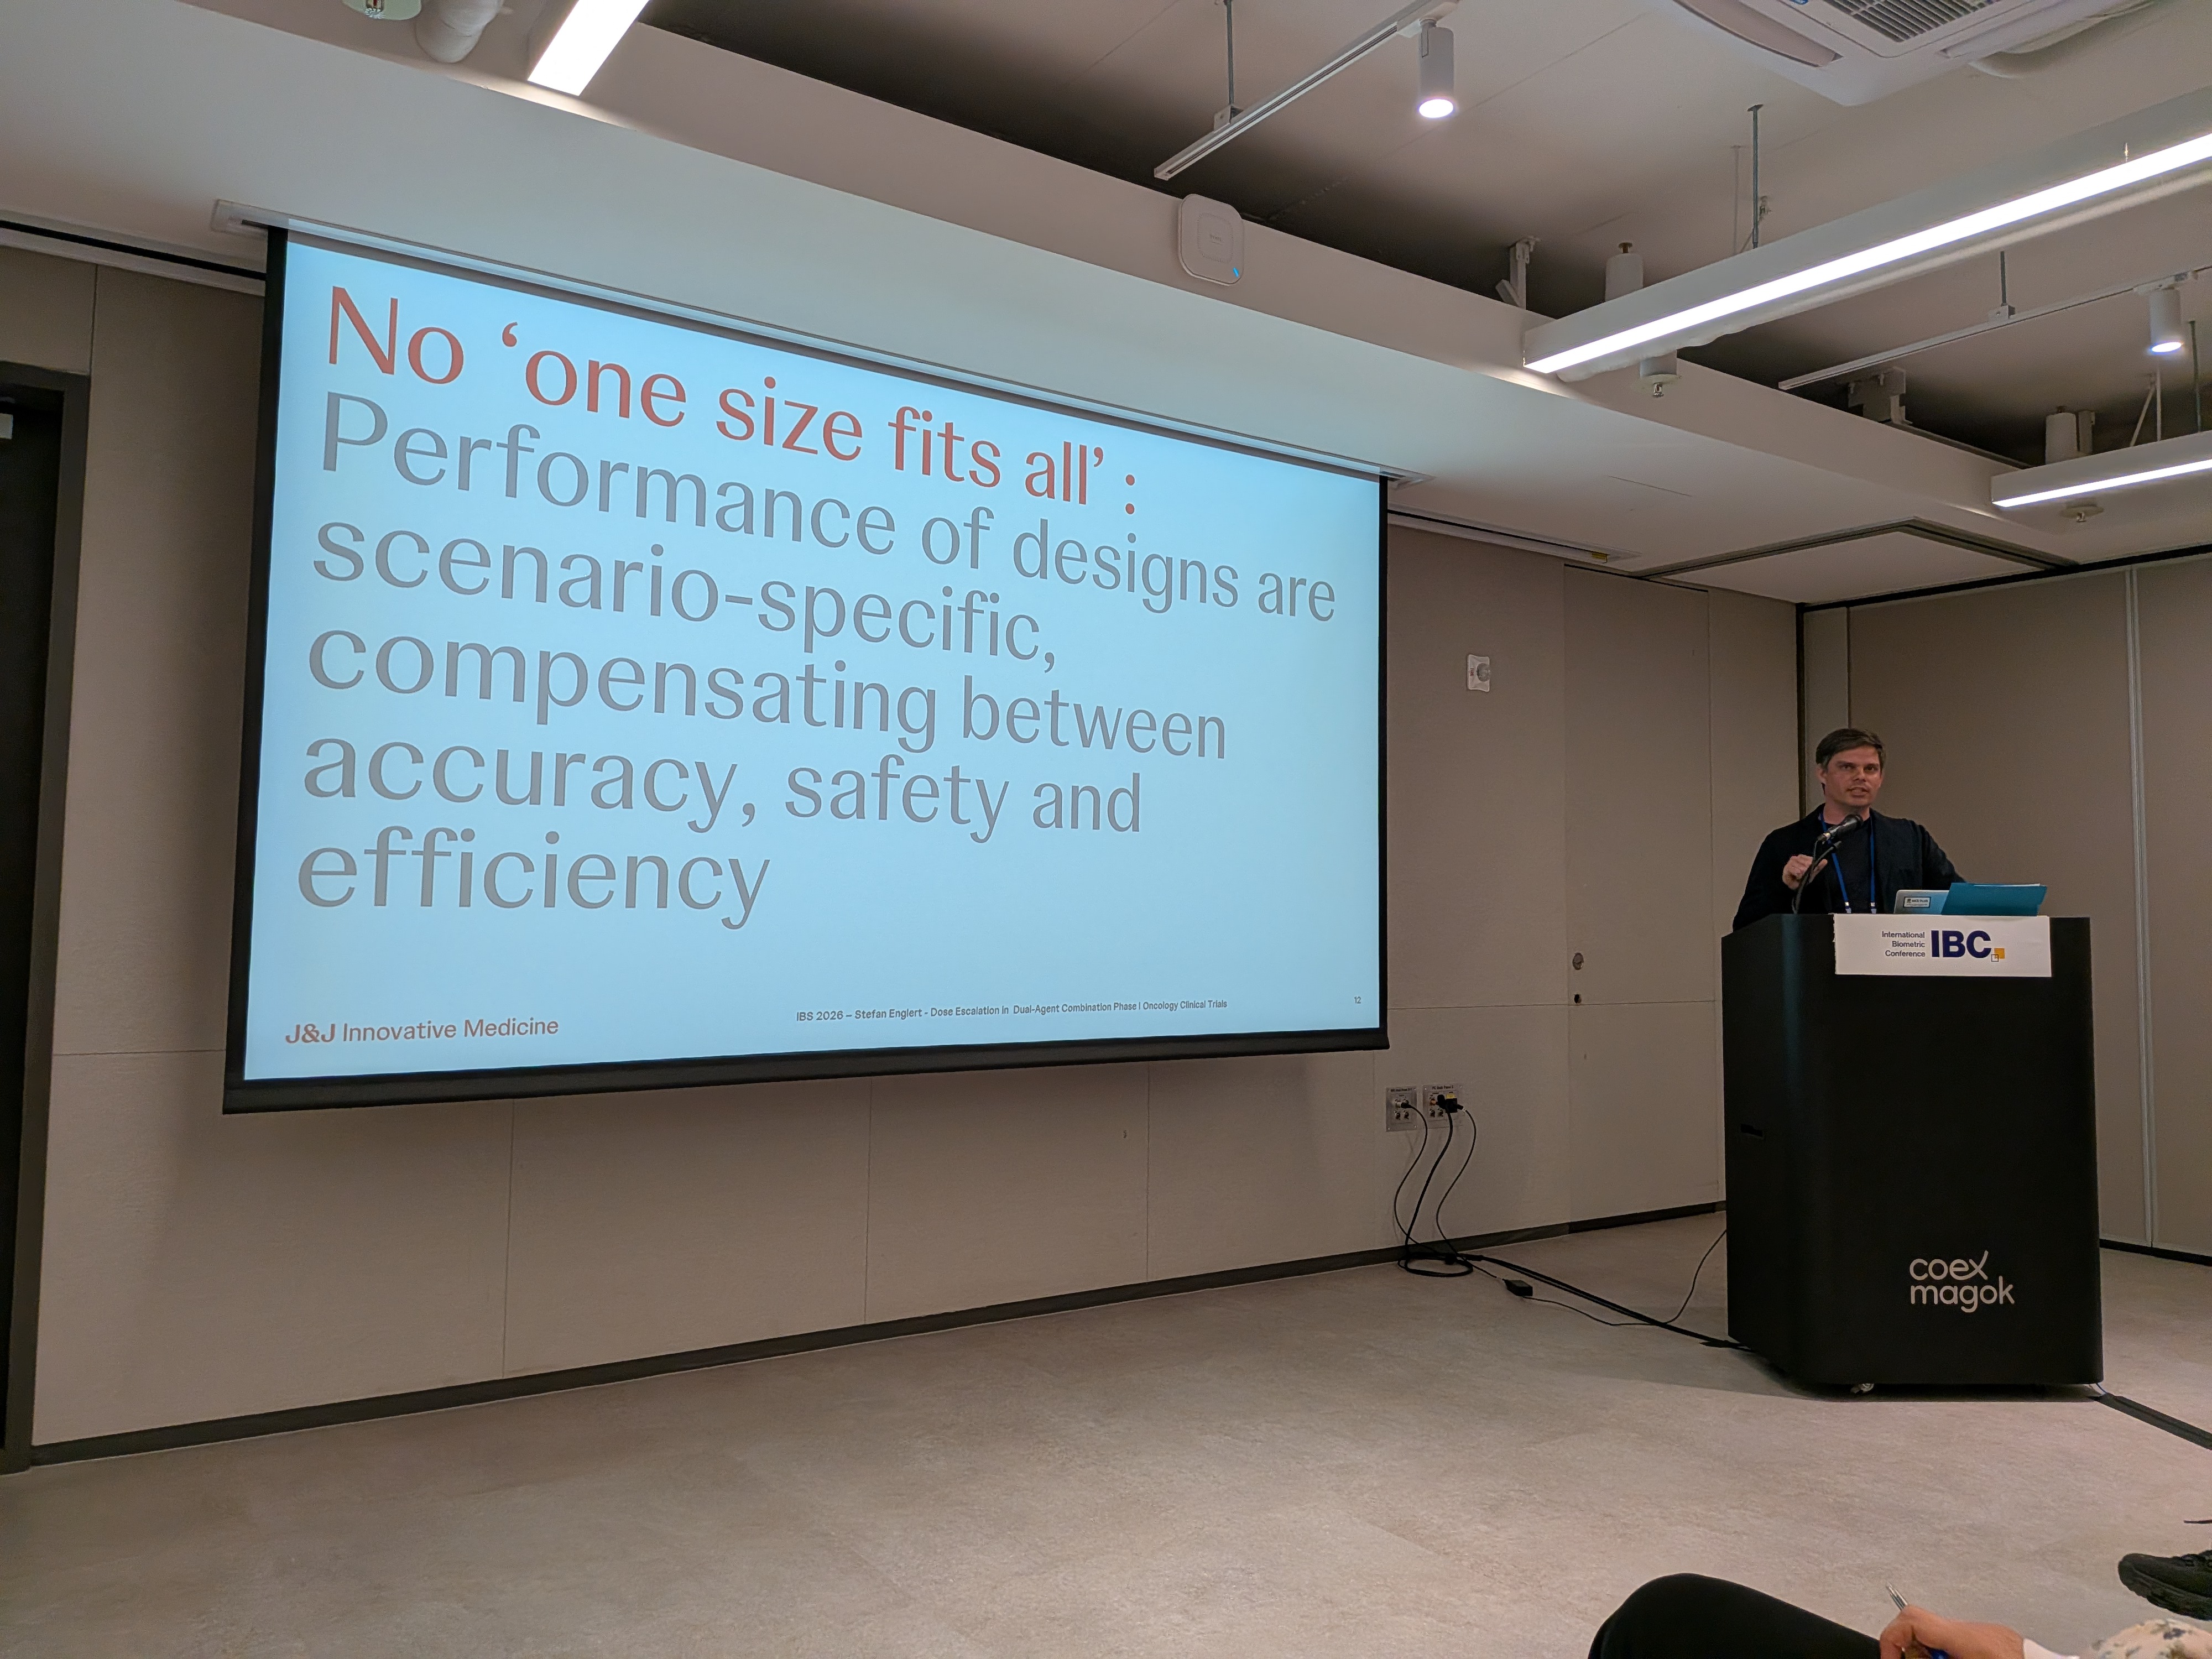
OP.33.04 Statistical Designs and Strategies for Simultaneous Escalation in Dual-Drug Combination Phase I Oncology Clinical Trials (Stefan Englert, Johnson & Johnson)
Objective:
- Compare frameworks for combination dose escalation through simulation studies.
Design considerations:
- Diagonal escalation constraints (cannot escalate both agents simultaneously).
- Compared 5-parameter Bayesian Logistic Regression Model (BLRM), combo-Bayesian Optimal Interval Design (BOIN), and rule-based toxicity-adaptive list design (TALE)
- Two-stage calibration for fairer comparison across methods.
Results:
- Combo-BOIN had strongest accuracy in reported simulations.
- BLRM used fewer patients in some settings.
- TALE not recommended based on poor results.
- Combination designs explored 2D dose space more effectively than sequential escalation.
OP.33.05 Benchmark Dose Estimation from Longitudinal Dose-Response Data (Heba Basha, University of Copenhagen)
- Focus on lower confidence limit of the benchmark dose (BMDL) and benchmark response (BMR) for longitudinal response processes.
- Applied to automated plant data under glyphosate dosing (Penolab).
- Time-smooth continuous dose-time-response modeling improved interpretability over separate-timepoint estimation.
OP.41 Tuesday 1:45-3:15 - Cluster Randomized trials, Subgroups and Related Methods
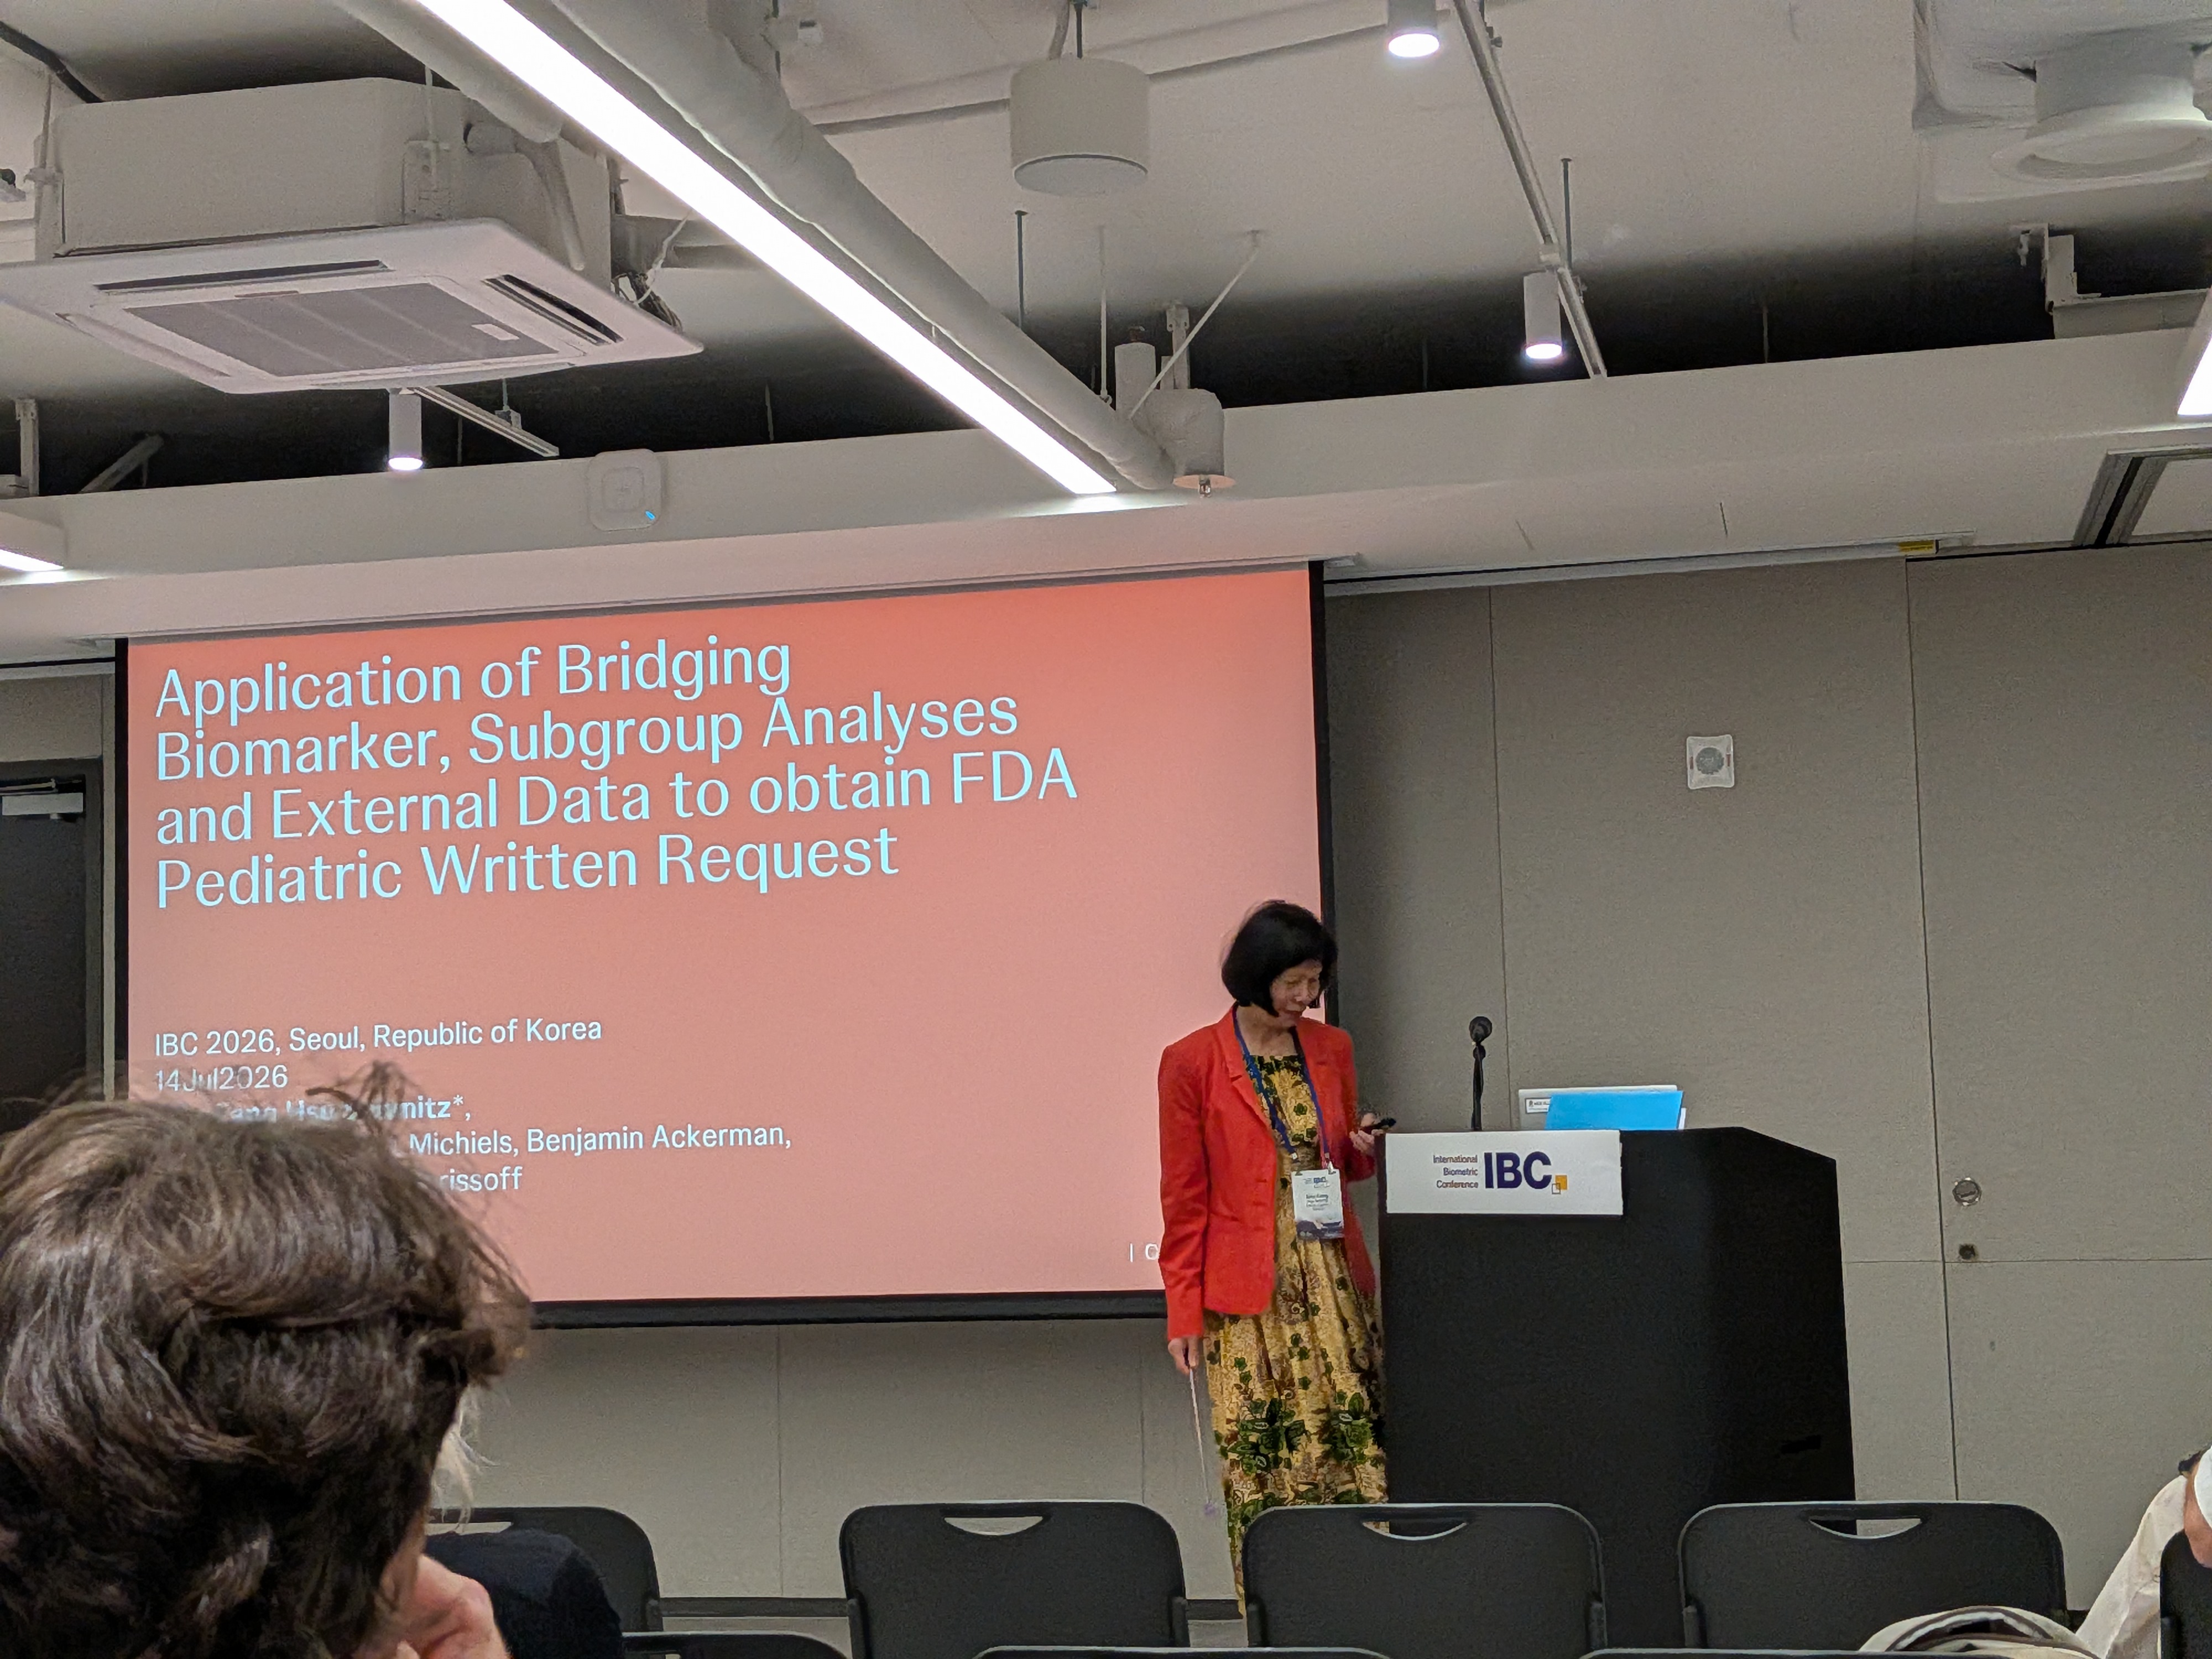
OP.41.01 Application of Bridging Biomarker, Subgroup Analyses and External Data to Obtain FDA Pediatric Written Request (Shu-Fang Schmitz, Johnson & Johnson)
Clinical context:
- Selexipag in pediatric pulmonary arterial hypertension (PAH).
- Development in children: mandatory for EMA, voluntary for FDA
- Time pressure to finish before expiry of patent: FDA needs to issue a written request
- Rare placebo-controlled double-blind Ph3 trial in children.
- FDA agreed to initiate program without written request because EMA needed earlier start.
Challenges:
- Too slow recruitment to reach accrual goal.
- Event rate lower than expected to reach total events (10 years instead of 5 years)
Adaptation strategy:
- Bridging biomarker approach (NT-proBNP change) (Fleming et al. 2023)
- Reported as explaining >50% of treatment effect on morbidity/mortality time.
- Enabled major sample size reduction (-50%) pathway: main regulatory endpoint was changed to NT-proBNP change, while the official primary study endpoint remained morbidity/mortality time.
Secondary challenge:
- Non-significant pediatric primary result overall.
- FDA did not accept this because the baseline mean of the biomarker was much lower than in the other adult studies, asked for subgroup analyses and external data analyses to support the pediatric program.
- Turns out that in the biomarker elevated baseline groups the effect is clinically relevant
- Additional combination with Ph2 data (propensity scores and Bayesian analysis)
Success: In the end, they got the full pediatric label.
OP.41.02 Bayesian covariate-adjusted response-adaptive randomisation in stepped-wedge cluster randomised trials (Constantin Schmidt, University of Cambridge)
Intro:
- step-wedge cluster randomized trial (SW-CRT) design: clusters switch from control to intervention at different time points.
Idea:
- Interim adaptation after early periods in stepped-wedge CRT.
Steps:
- Bayesian posterior updating and permissible allocation matrix set.
- Compound utility balancing efficiency and benefit.
- Thompson sampling randomization.
Results:
- BayesCARA SW-CRT is the official name of the proposed method
- Can be extended to closed-cohort designs
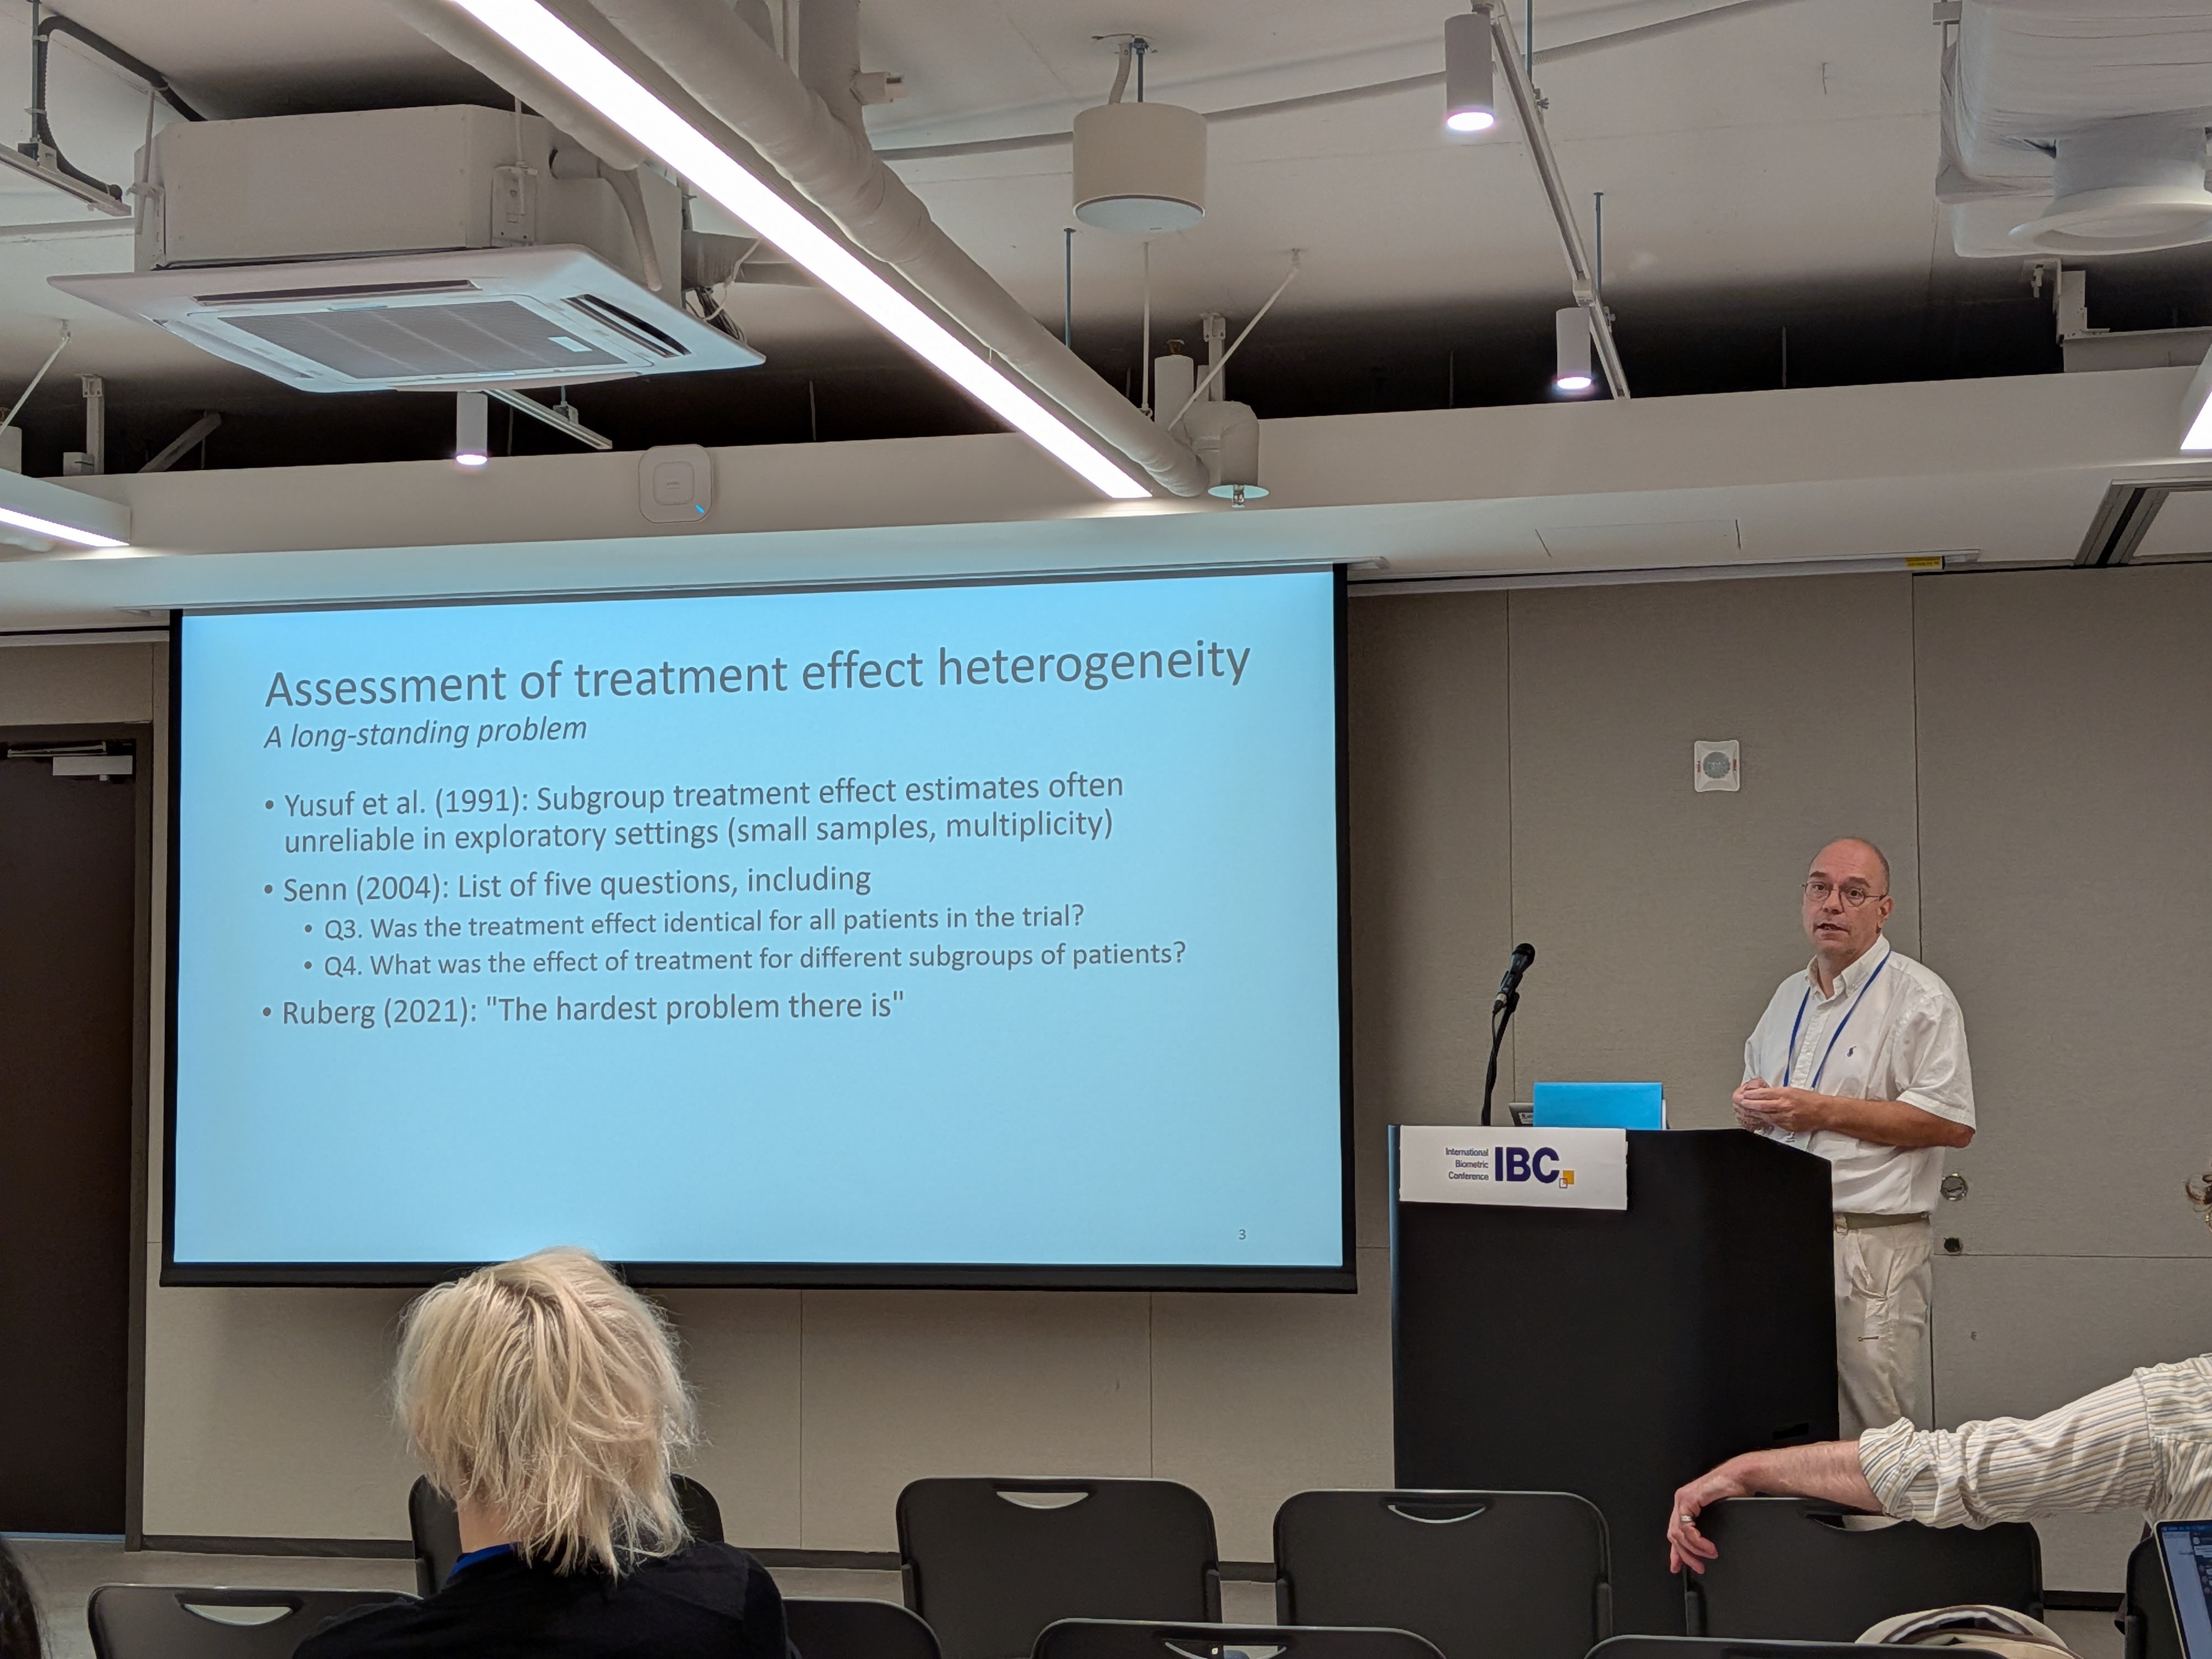
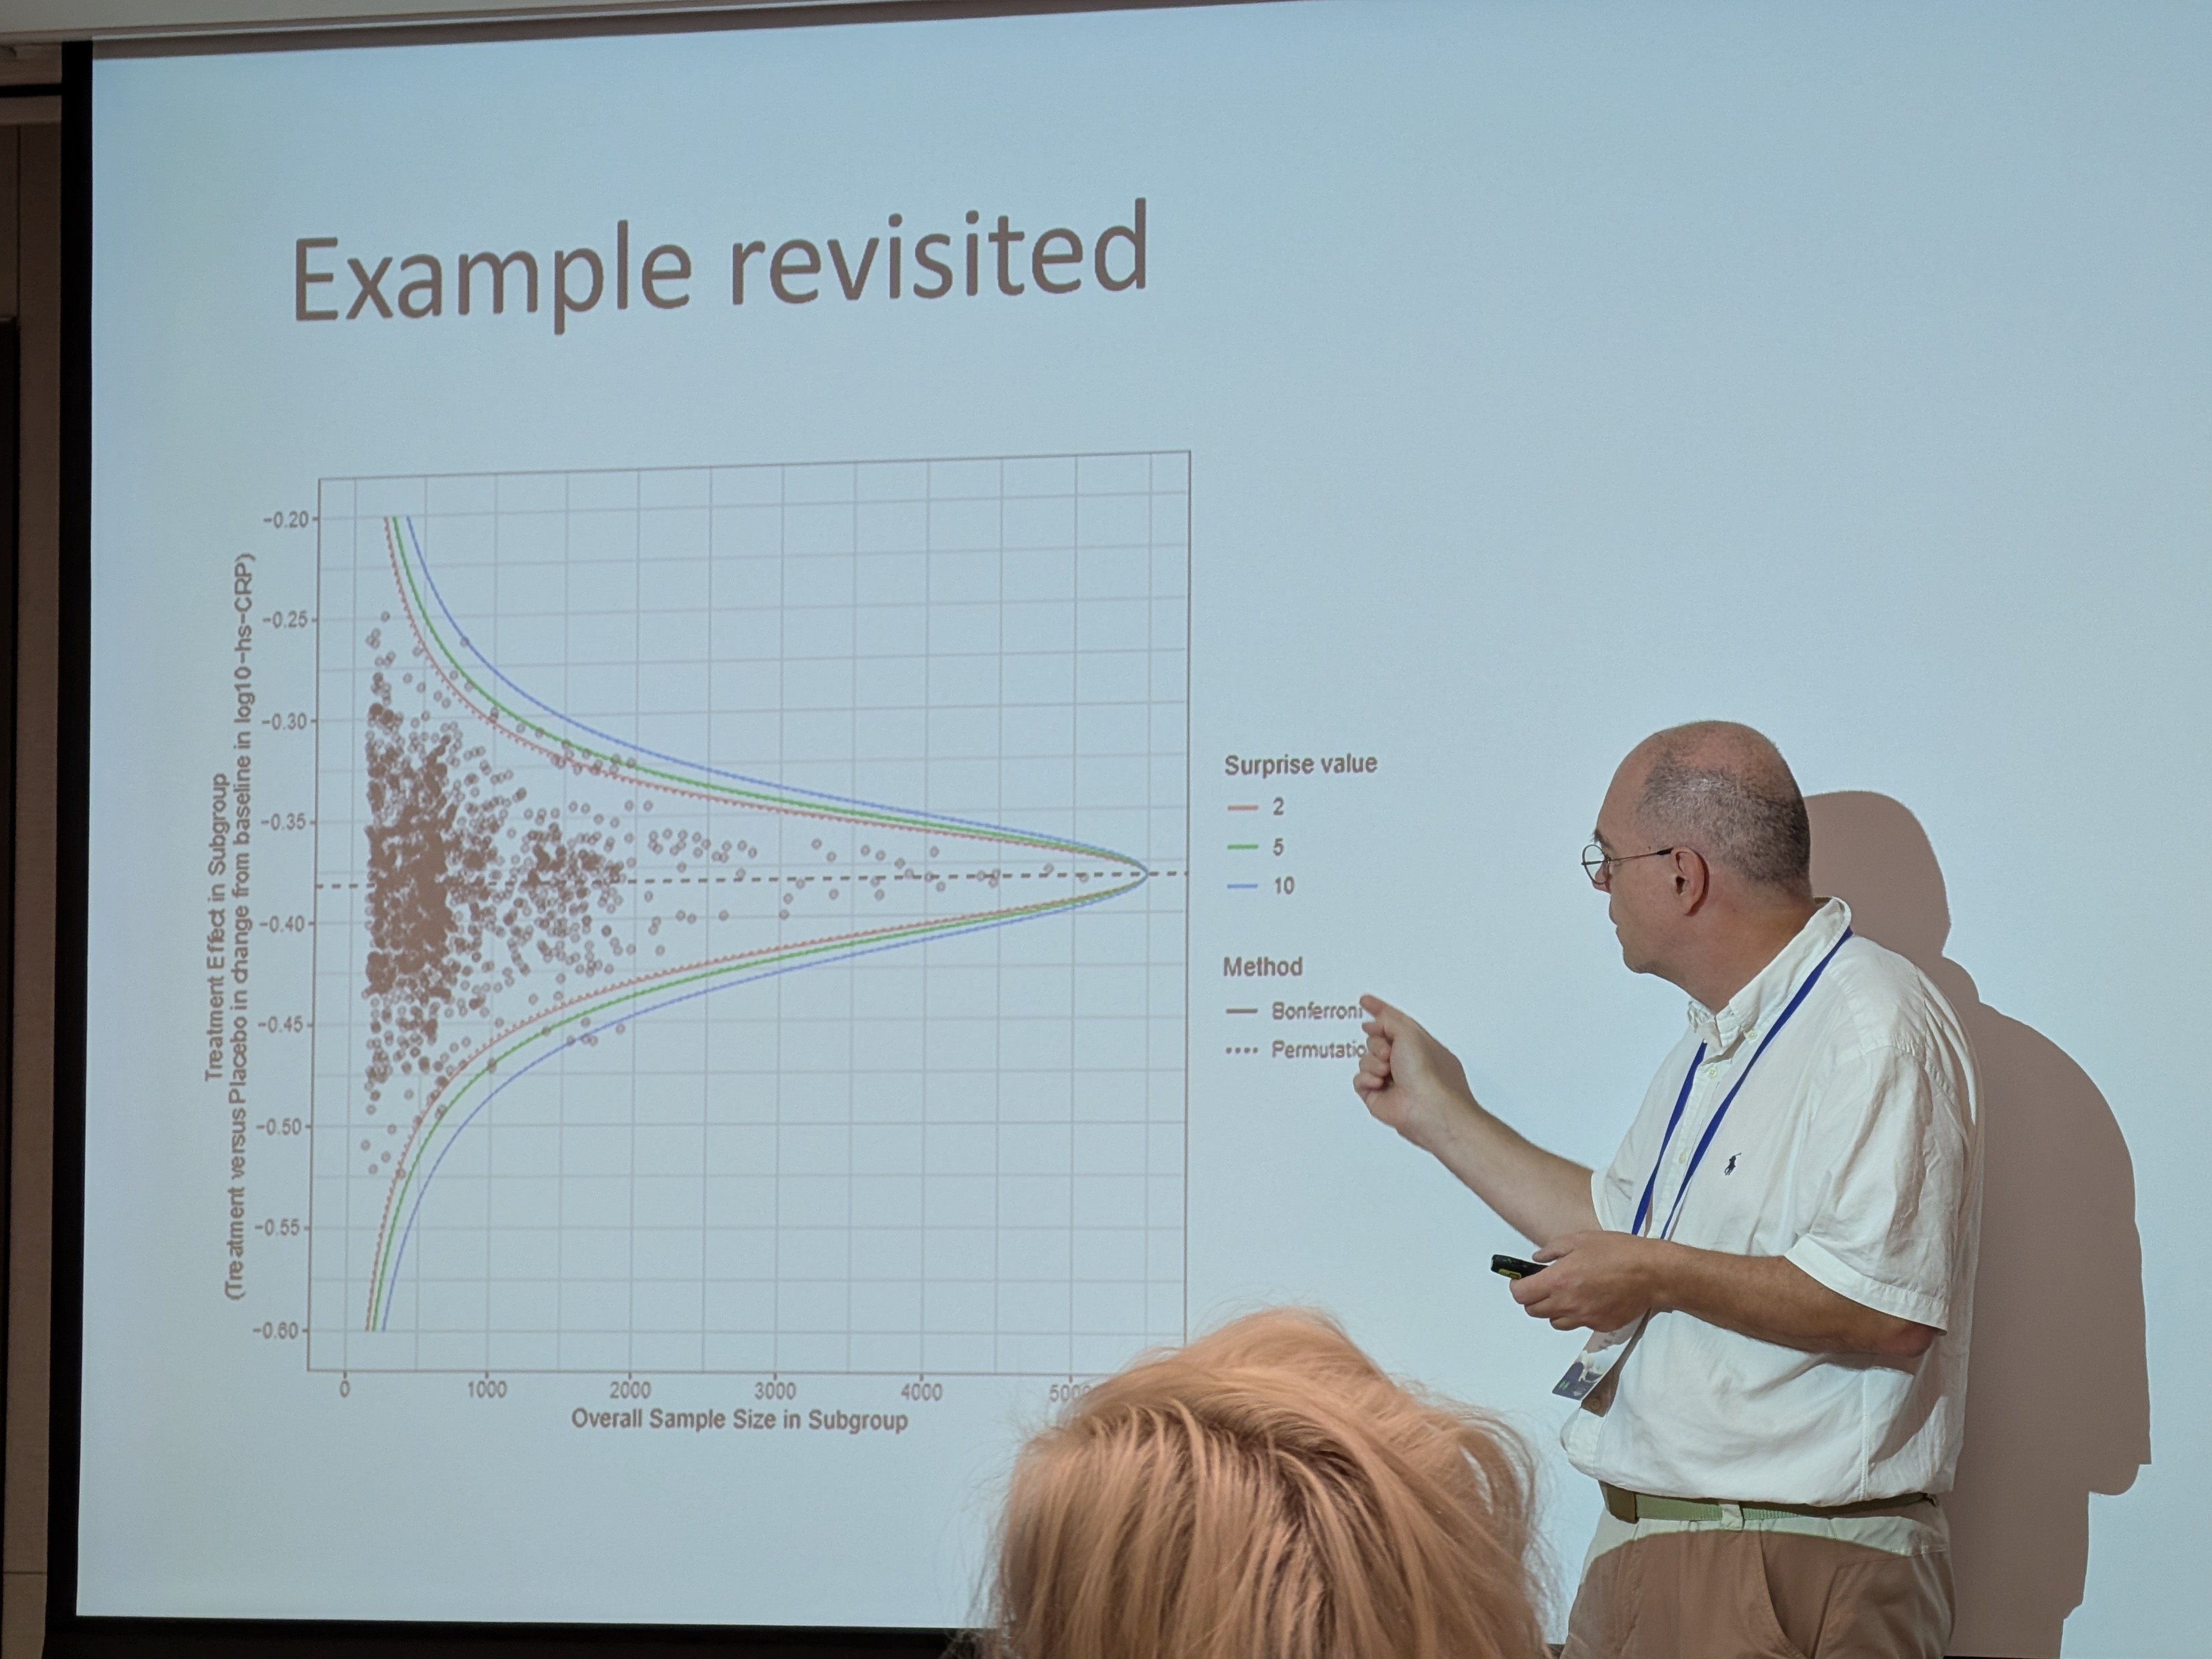
OP.41.03 Assessment of Global Evidence Against Homogeneity for Exhaustive Subgroup Treatment Effect Plots (Frank Bretz, Novartis)
Background:
- Long-standing treatment-effect heterogeneity challenge, goes back to a paper by Yusuf et al. (1991)
Methodological components:
- Exhaustive subgroup effect plots (subgroup size on x-axis, effect on y-axis) implemented in the subscreen package.
- Homogeneity region construction for treatment-effect differences.
- Divergence p-values (Greenland 2023) interpreted as discrepancy metrics (not binary hypothesis test outputs).
- So far, no formal method was proposed
Objectives:
- Assess global consistency with homogeneous treatment effect model.
- Identify subgroups with differential effect versus overall population.
- Take into account the correlation structure of the subgroup effects.
OP.41.04 Repeated inclusion cluster randomised trials: a new class of designs for assessing group-level interventions (Jessica Kasza, Monash University)
- Motivated by clusters willing to re-enter related studies.
- Re-randomization concepts translated to cluster settings (Kahan et al. 2015).
- Potential power increase from repeated cluster inclusion in some settings (Kasza et al. 2026).
OP.41.05 Staircase cluster randomised trial designs: optimal allocation of clusters to sequences (Kelsey Grantham, Monash University)
- Correlation structure depends on ICC and autocorrelation.
- Unequal randomization proportions can be optimized for treatment effect variance reduction.
S.24 Tuesday 4:00-5:30 - Practical Considerations for Covariate Adjustment in Clinical Trials
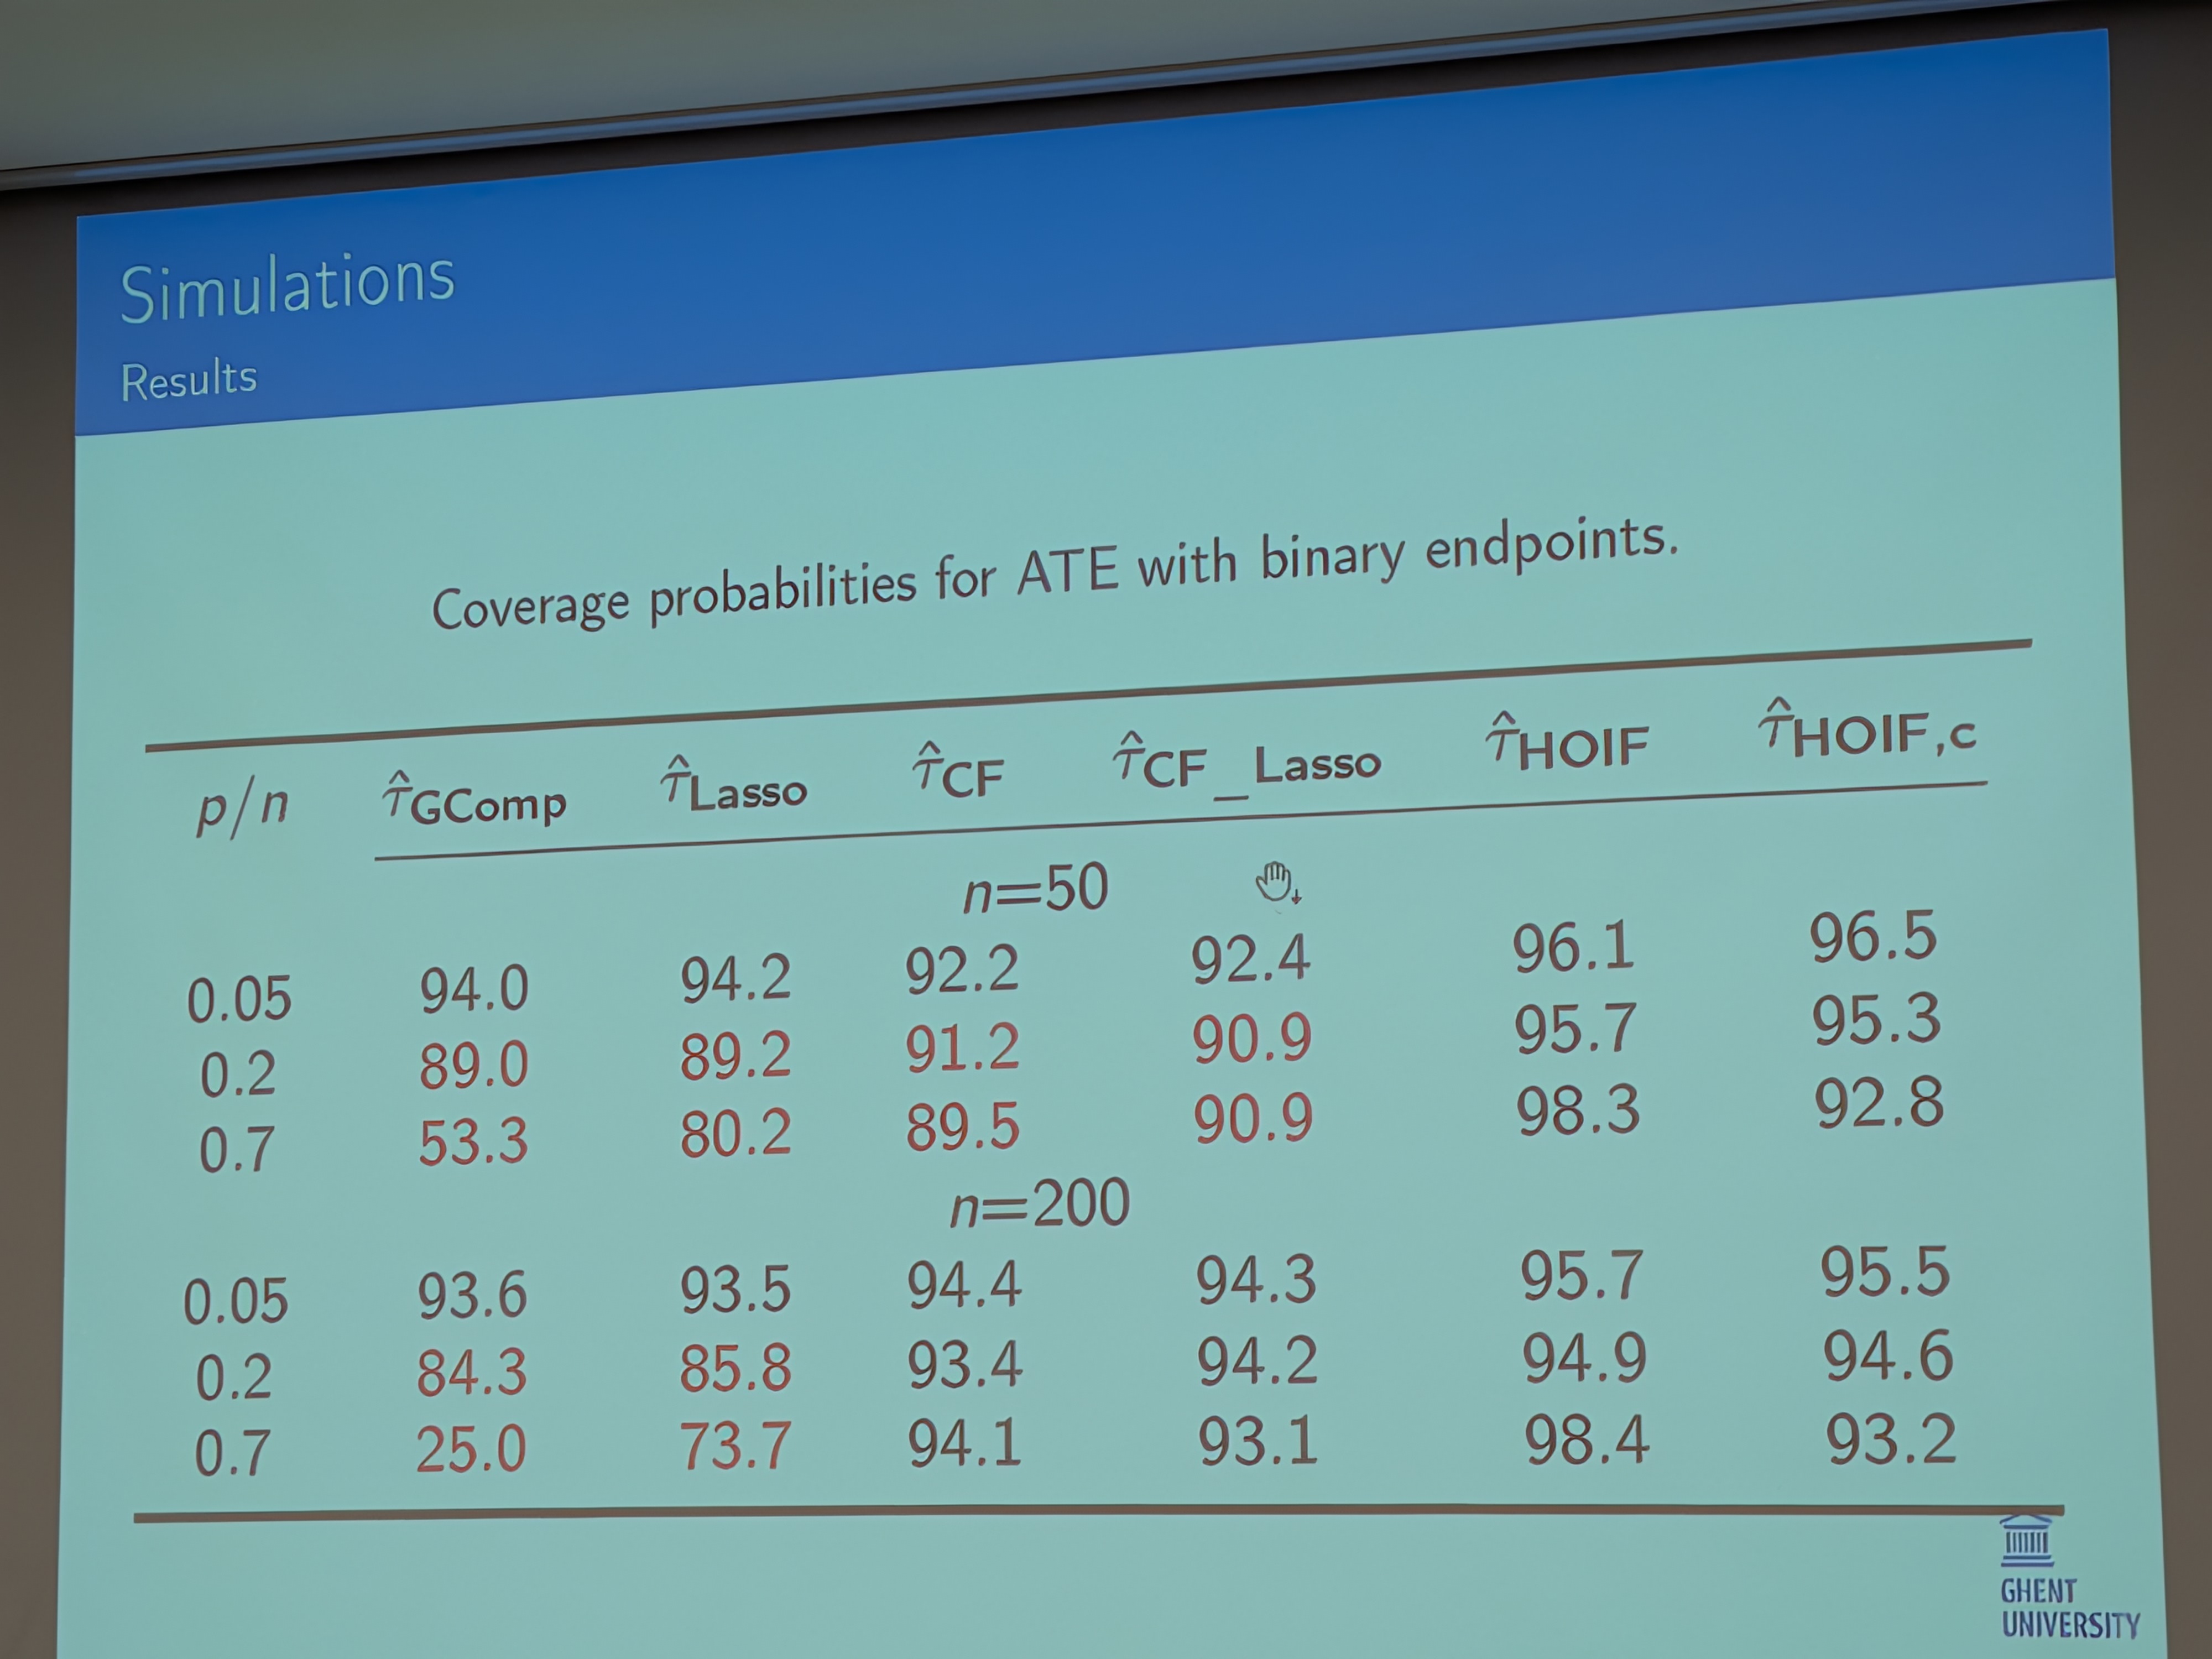
IS.24.01 Performance of G-computation estimators in small randomized controlled trials with many covariates (Muluneh Aleneh Addis, Ghent University):
Motivation:
- Asymptotic robustness of G-computation (based on prediction unbiasedness under canonical GLMs, see Bannick et al. (2025)) does not guarantee finite-sample reliability (especially when you have many covariates but only few subjects).
- Overfitting bias (smaller problem than for ML inference) and standard error underestimation are key risks.
Proposed practical mitigations:
- Variable selection (e.g. LASSO) and post-selection (e.g. post-LASSO) modeling.
- Penalized/Bayesian approaches (e.g. Firth regression) plus targeting corrections (to restore prediction unbiasedness) e.g. via targeted maximum likelihood estimation (TMLE).
- Cross-fitting (but here you still need to apply TMLE).
- Higher-order influence function (HOIF) based estimates.
Simulation results:
- Severe confidence interval undercoverage (< 50% actual coverage) observed in some small-sample settings.
IS.24.02 Practical considerations in using the covariate-adjusted log-rank test in an adaptive design (Daniel Backenroth, Johnson & Johnson):
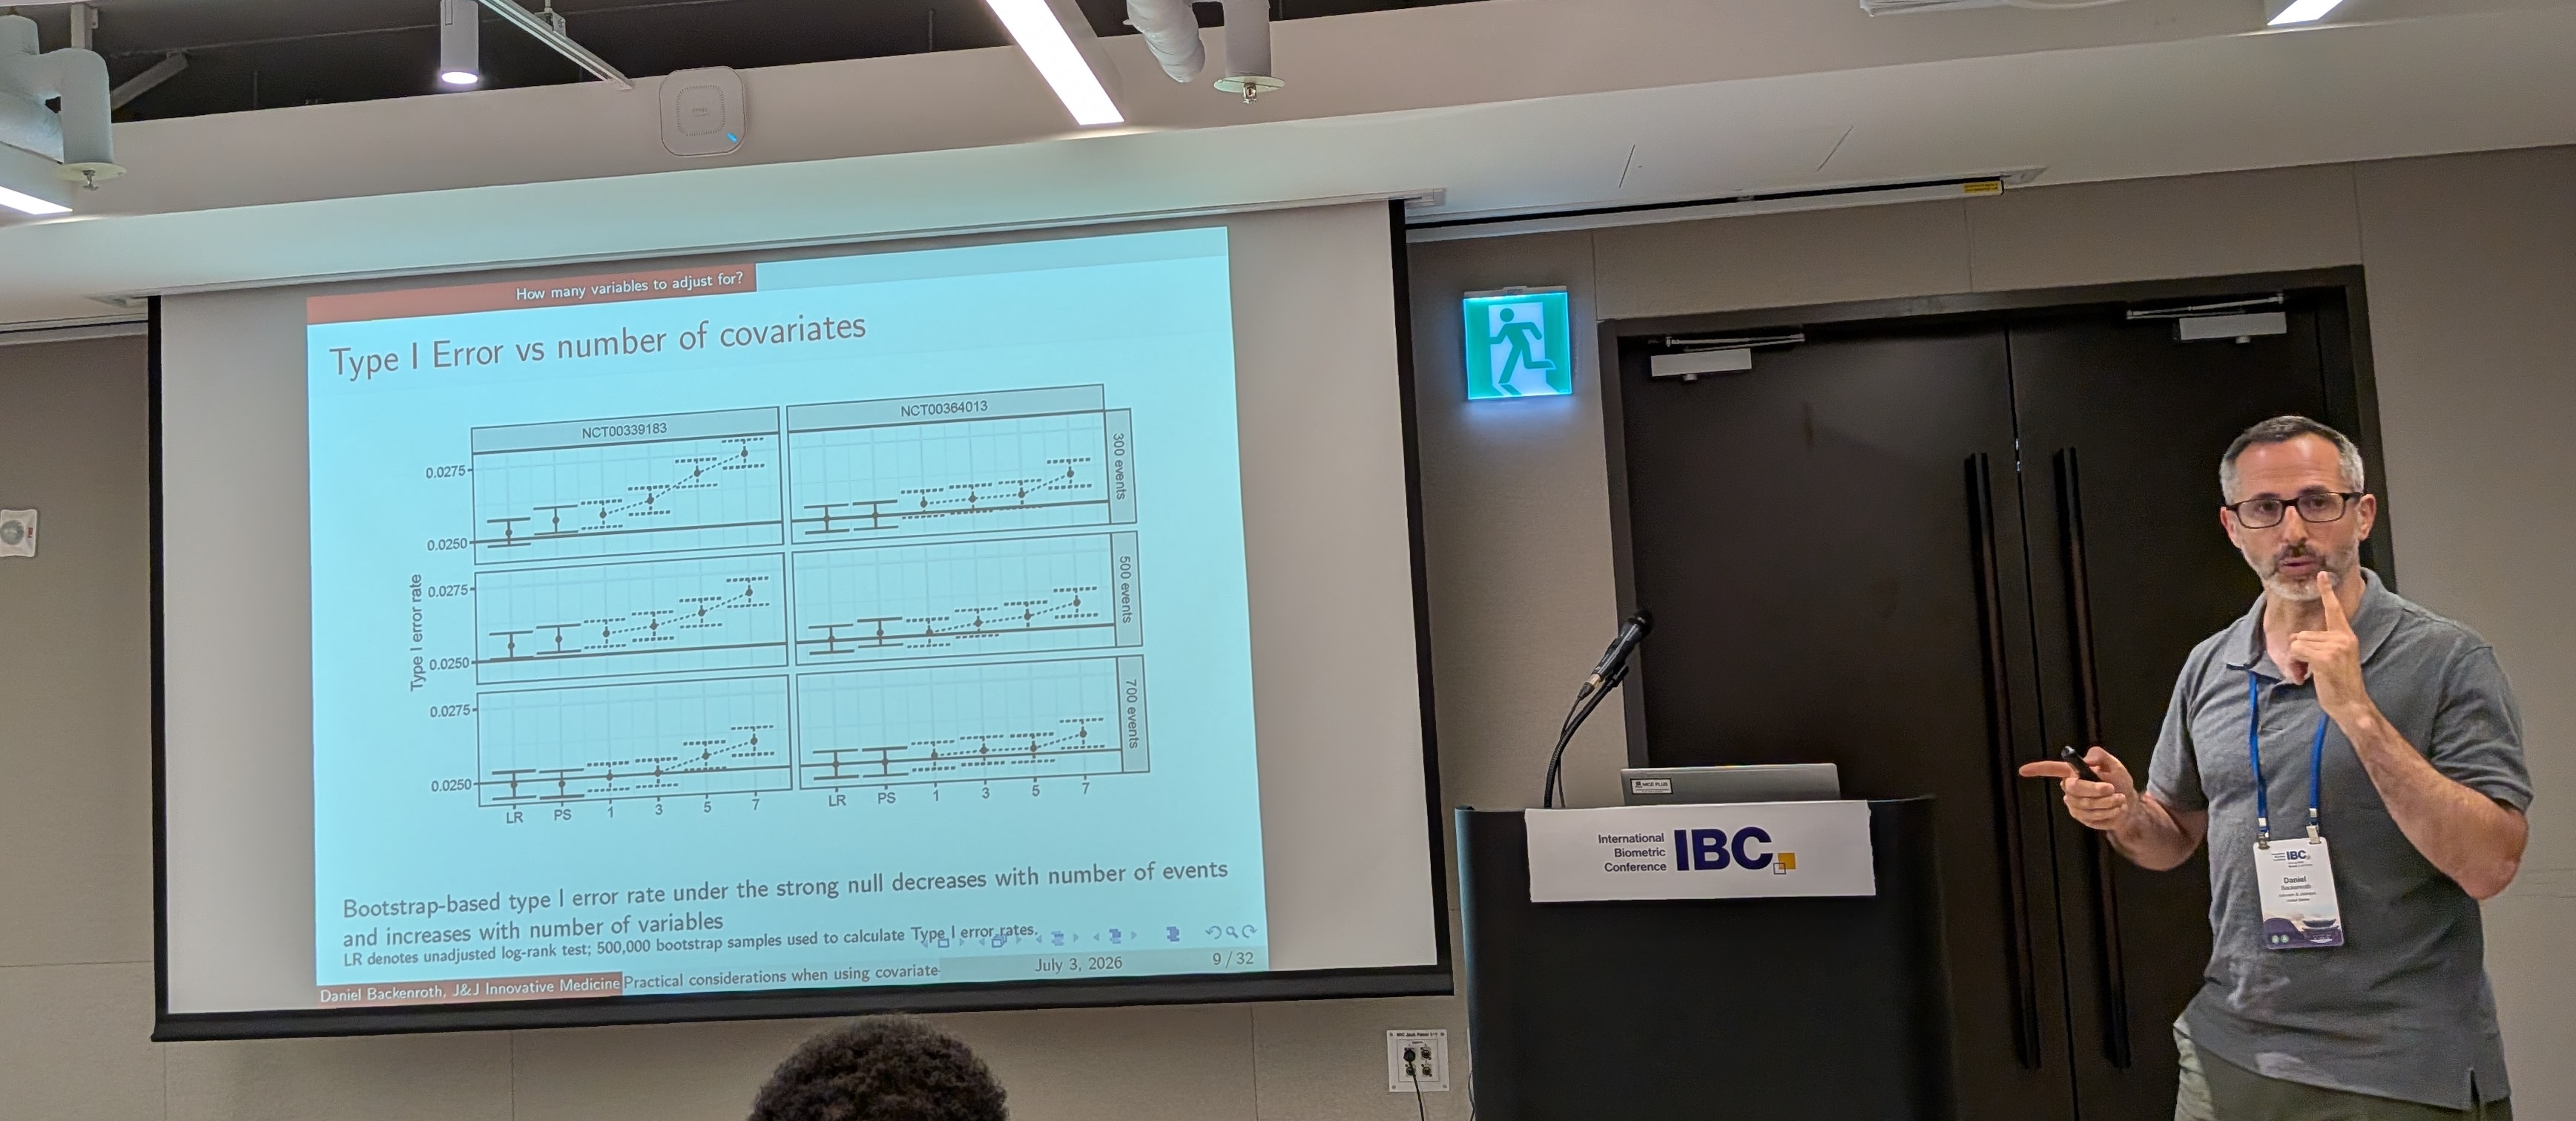
- The covariate-adjusted log-rank test is available e.g. in
RobinCar2(Li et al. 2026)- The variance reduction can be estimated from historical studies
- They looked at real clinical trials from Project DataSphere.
- As number of covariates increases you can increase your Type I error (T1E) slightly above nominal level (here 0.025)
- Problem: as the effect gets stronger the T1E is increasing
- But you can use a small sample size correction, which then keeps the nominal T1E
- It is an HC, heteroskedasticity based, correction
- This can also be combined with group sequential designs
- How can we take advantage of covariate adjustment in practice?
- Conservative approach: Just increase power upwards from the nominal power.
- More risky approach: Reduce number of enrolled patients / target number of events but maintain the power.
- Van Lancker et al. (2025) propose information monitoring with covariate adjustment, to keep track of realized variance reductions and potentially do the analysis earlier (basics of this go back to Mehta and Tsiatis (2001)).
IS.24.03 Empirical Evaluation of Efficiency Gains from Covariate Adjustment in Clinical Trials (Cristina Sotto, Johnson & Johnson)
- Large retrospective analysis across 43 studies in Johnson & Johnson.
- Up to 250 analyses per method.
- Focus on the following covariates:
- baseline value of endpoint
- stratification variables
- demographic variables
- variables from “Table 1”
- Methods included g-computation and TMLE with/without cross-fitting.
- Noted that TMLE can be computationally intensive and unstable for small samples.
- Results:
- As the prognostic value gets larger, then of course the efficiency gains get larger too.
- T1E inflation: some with g-computation, but even more with TMLE.
- Cross-fitting is needed to maintain T1E.
- Note that Shao et al. (2026) also discuss empirical evidence from 50 clinical trials for covariate adjustment.
IS.24.04 Discussion: Practical Considerations for Covariate Adjustment in Clinical Trials (Sanne Roels, Johnson & Johnson)
- Important to stay robust against model misspecification
- Single robust: g-computation, inverse probability of treatment weighting
- Double robust: TMLE
- Cross-fitting is now also getting increasingly recommended when using TMLE to avoid overfitting.
- Implemented in R – for TMLE can use the vanilla tmle package which has a lot of guardrails etc. but the actual workhorse is just 10 lines of code or so. So, it is not that hard.
- And discuss proposals in advance with the relevant review division at FDA!
- Important: contrast the treatment arms, and focus on the estimand of interest
- Forget about the direct use of model coefficients!
- Advantage: we have all this nice baseline data collected in clinical trials
IS.07 Wednesday 10:15-11:45 - Borrowing Strength across Studies and Populations: Modern Strategies for Integrative Inference in Biomedical Research
IS.07.01 Perspectives on Integrative Evidence in Modern Trial Design (Koko Asakura, National Cerebral and Cardiovascular Center)
- Introduced the session’s range of approaches to integrating evidence from studies and populations.
- The discussion emphasized that borrowing assumptions need to be clinically interpretable and prespecified.
IS.07.02 Data Integration With Biased Summary Data via Generalized Entropy Balancing (Kosuke Morikawa, Iowa State University)
Setting:
- Individual-level internal data are available together with external summary data.
- Direct integration may be biased when the covariate distributions differ between the internal and external sources.
Proposal (Morikawa et al. 2025):
- Reweight the external information using generalized entropy balancing.
- The motivating illustration used two point clouds with different regression lines: the aim was to estimate the internal-population regression while using external observations for additional information.
- The framework supports generalized linear models as well as ordinary least squares.
- The estimator is doubly robust with respect to the density-ratio and outcome-regression models.
Practical guardrail:
- A large Mahalanobis distance between the internal and external populations indicates insufficient overlap and that borrowing should not be used.
IS.07.03 Bayesian dynamic borrowing with applications to combining randomized controlled trials and real world data (Tim Friede, University Medical Center Göttingen)
- The heterogeneity-prior scale acts as the main regulator of dynamic borrowing.
- It therefore needs to be prespecified, and operating characteristics should be assessed for plausible alternative values.
- A floor on the weight assigned to the randomized trial data prevents the external data from overwhelming the concurrent evidence.
IS.07.04 Use of Bayesian Hierarchical Mixture Model for Classification of Baskets (Chin-Fu Hsiao, National Health Research Institutes, Taiwan)
Motivation:
- Precision oncology has shifted development from disease-centric to biomarker-centric programs.
- Basket-specific response counts are modeled as binomial outcomes with a logit link.
Proposal:
- A data-driven Bayesian hierarchical mixture model groups baskets into active, inactive, and intermediate efficacy classes.
- Information is borrowed within efficacy classes rather than according to a prespecified similarity measure; related Bayesian hierarchical borrowing ideas are discussed by Liu et al. (2017).
- The resulting classification is used to define an adaptive basket-trial design.
Results and discussion:
- Reported operating characteristics were similar to EXNEX in the examined scenarios.
- The homogeneity assumption is not removed entirely: it moves from similarity of response rates to sharing a clinical decision threshold.
IS.27 Wednesday 1:00-2:30 - Recent Methodological Advances for Handling Intercurrent Events in Causal Inference Analyses
IS.27.01 Assessing Interactive Causes of an Occurred Outcome Due to Two Binary Exposures (Shanshan Luo, Beijing Technology and Business University)
Motivating question:
- If a person who smoked and was exposed to asbestos developed lung cancer, how much causal responsibility belongs to smoking, asbestos, and their interaction?
- This is a retrospective “cause of an effect” question at the counterfactual level of the causal ladder, rather than the usual prospective “effect of a cause” question.
Method (Luo et al. 2026):
- Represent individuals by latent counterfactual response patterns, such as disease caused only by smoking, only by asbestos, or synergistically by both exposures.
- Weight the possible patterns by their posterior probabilities.
- Average those pattern-specific responsibilities to obtain an average causal responsibility for each exposure and their interaction.
IS.27.02 Exploiting Date-of-Birth Eligibility for Shingles Vaccination in Wales to Estimate Time-Varying Survivor Average Causal Effects for Compliers (Jay Xu, University of Toronto)
Setting:
- Date-of-birth eligibility for shingles vaccination in Wales provides an instrumental-variable-style natural experiment.
- The target combines two layers of principal strata: vaccination-compliance strata and survivor strata indexed by time.
Proposal:
- Define time-varying survivor average causal effects among compliers.
- Model the observed multi-state hazards for eligibility groups and treatment receipt using Weibull hazards with gamma frailty, giving a closed-form marginal likelihood.
- Model compliance with a probit regression.
Bayesian g-computation:
- Generate covariates, frailties, and compliance states from the fitted model.
- For simulated compliers, generate dementia and death times under both eligibility conditions.
- Contrast the simulated outcomes; this step relies on a cross-world independence assumption that may be scientifically debatable.
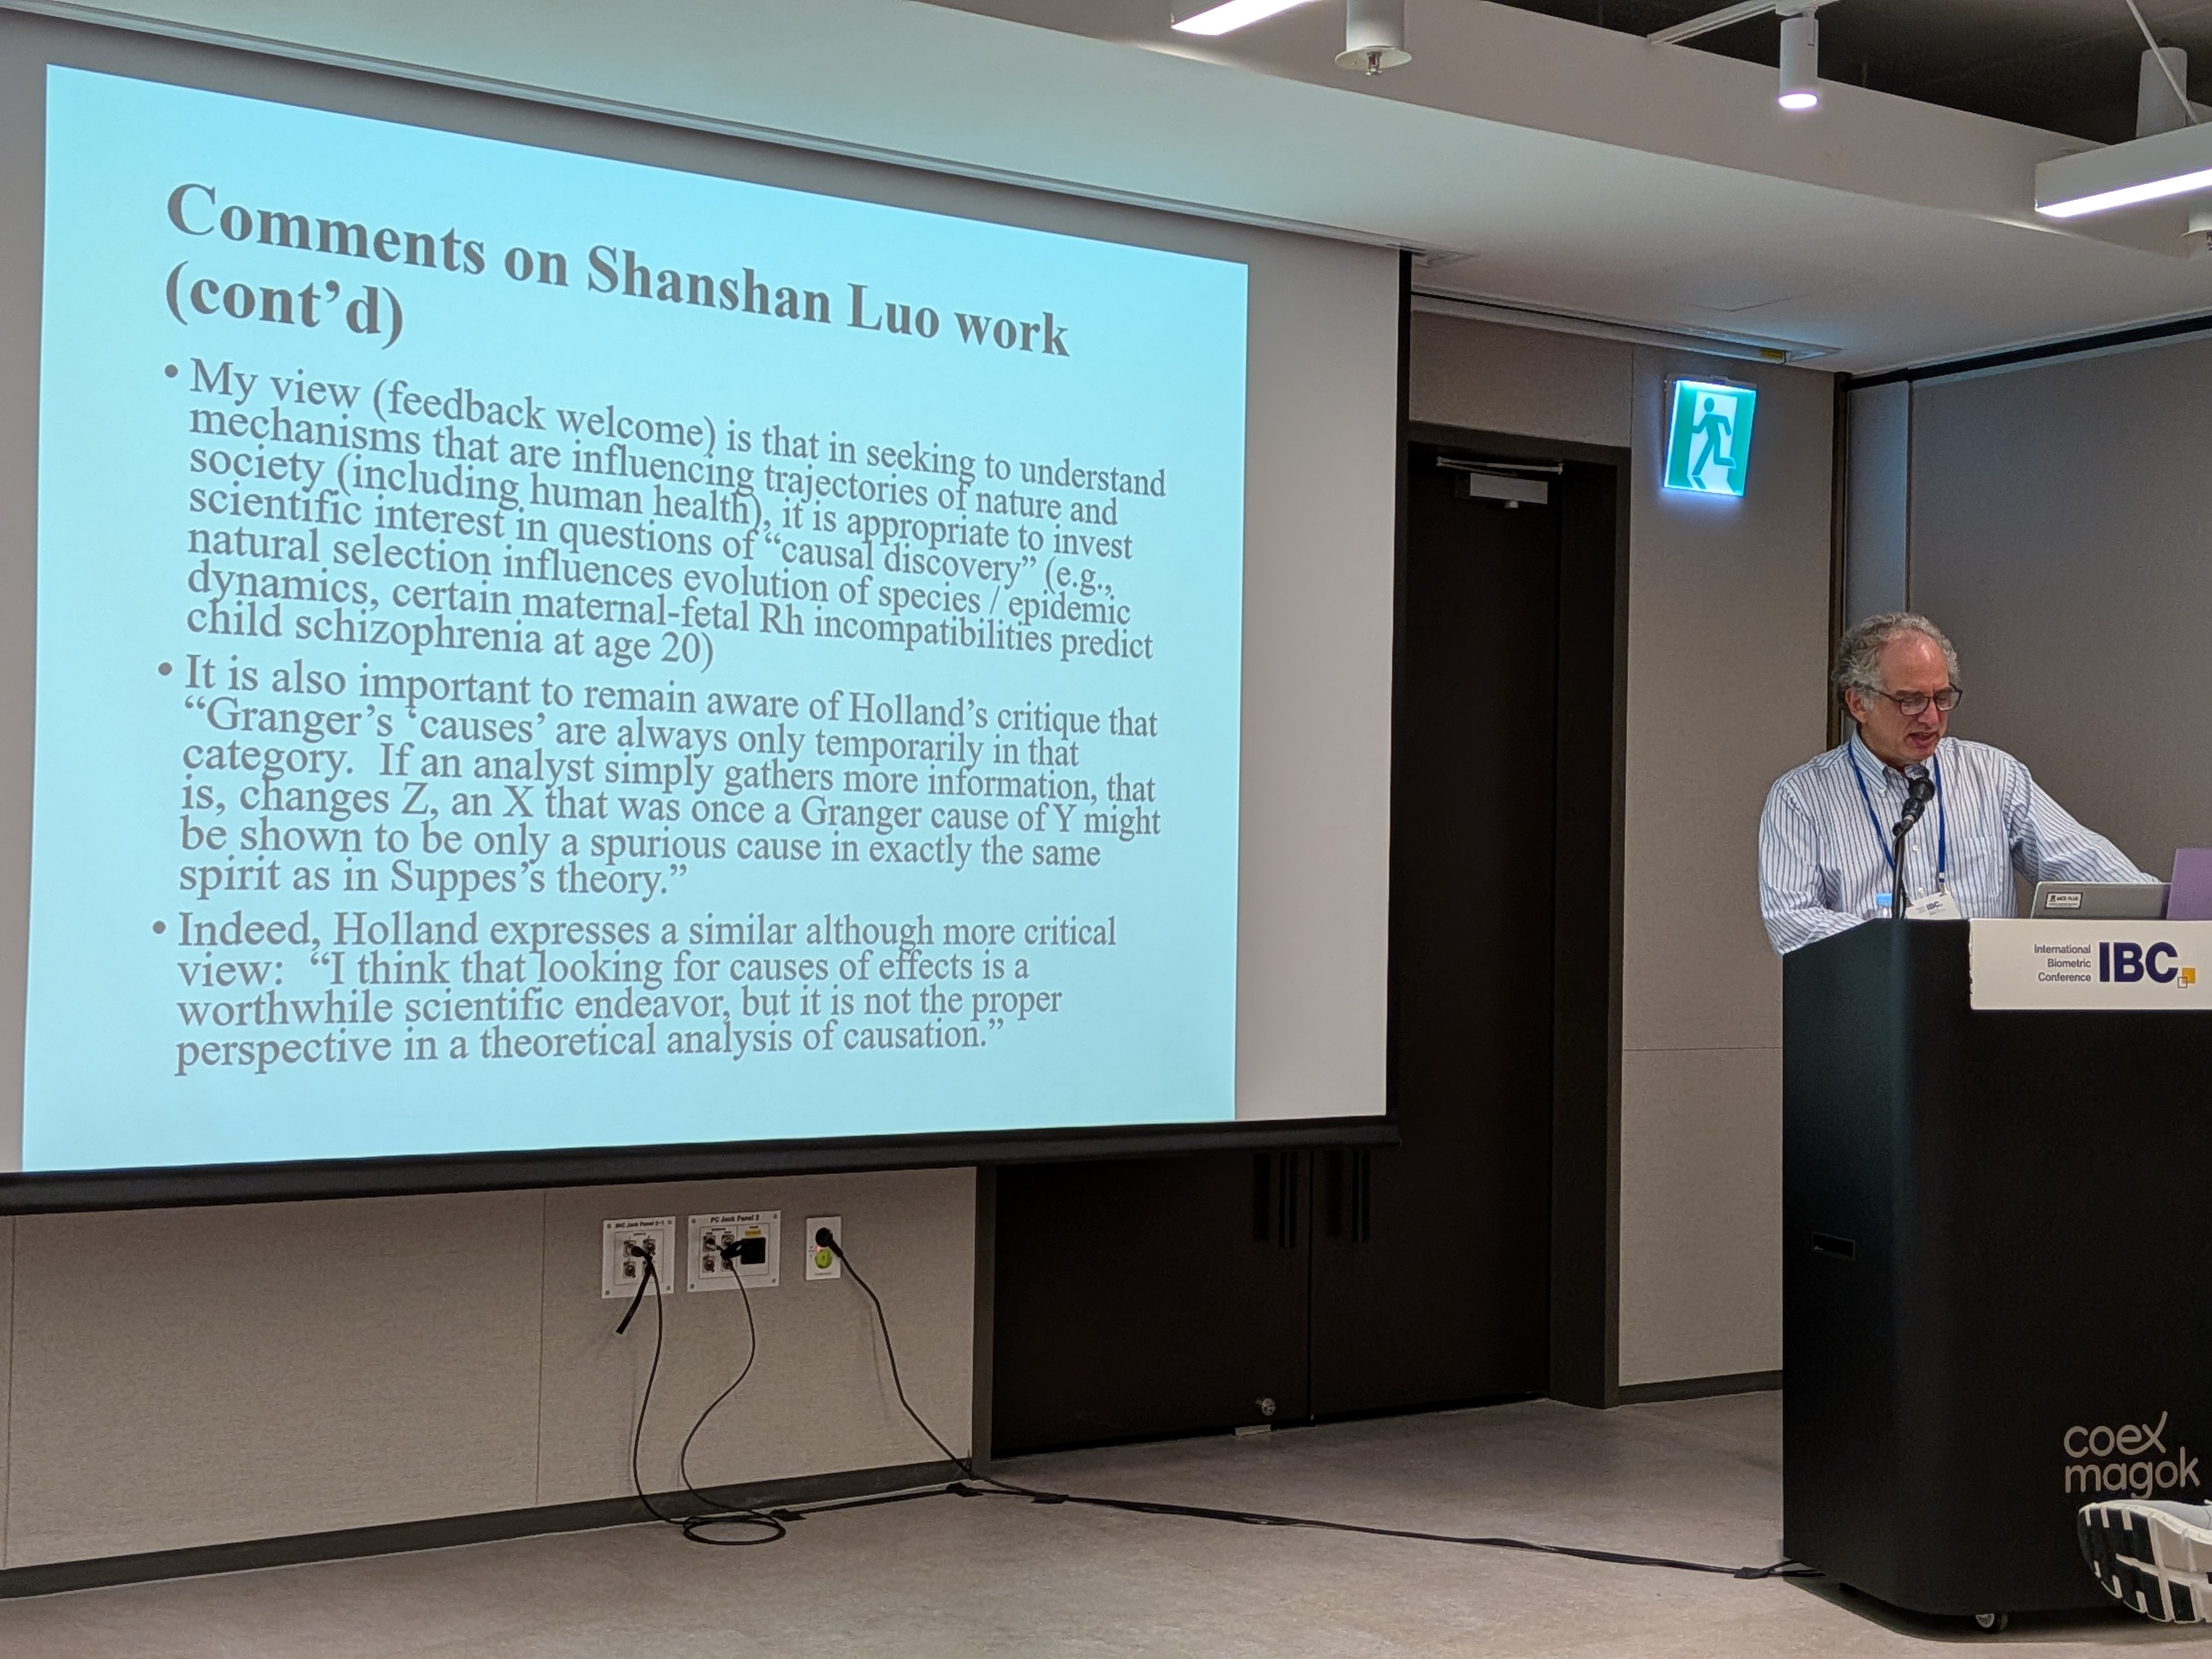
IS.27.03 Discussion of “Recent Methodological Advances for Handling Intercurrent Events in Causal Inference Analyses” (Thomas R. Belin, University of California, Los Angeles)
- Luo’s distinction between effects of causes and causes of effects was connected to classic work by Granger (1969) and Holland (1986).
- The discussion noted that an intervention can have multiple causal effects, potentially with very long lead times.
- For outcomes truncated by death, a pragmatic alternative is to combine survival and quality of life, but this changes the estimand and its interpretation.
- Zhou’s four-step formulation was linked to the potential-outcomes framing in Rubin (1978).
- The discussion also referenced the 2018 ASA Ethical Guidelines for Statistical Practice (American Statistical Association 2018).
IS.27.04 Causal inference for all: Marginal causal effects for outcomes truncated by death (Linbo Wang, University of Toronto)
Motivation:
- Quality of life is undefined after death, so treatment effects cannot be summarized by a standard outcome contrast at every time point.
- The survivor average causal effect (SACE) targets patients who would survive under either treatment, but this latent subgroup is difficult to identify and explain in practice.
Proposal (R. Zhao et al. 2026):
- Define marginal estimands that apply to the full target population rather than only the always-survivor principal stratum.
- Consider the treatment effect at the final assessment before death and an average treatment effect over the time a patient is alive.
- For a period in which a patient would survive under only one treatment, report the absolute quality of life under that treatment because no within-patient contrast is defined.
Limitation:
- Patients contribute over different follow-up intervals, which requires care when interpreting population averages.
IS.27.05 Precisely defining estimands in clinical trials: A unified procedure (Andrew Zhou, Peking University)
Four-step proposal:
- Define the treatment attribute.
- Define the target population.
- Define the outcome attribute.
- Combine these elements to define the estimand.
Mapping to ICH E9(R1) strategies:
- A principal-stratum strategy modifies the target population; in a two-arm trial, stratum membership depends on whether the intercurrent event would occur under neither, either, or both treatments and is therefore latent.
- A hypothetical strategy modifies the potential outcome, for example by imputing the outcome that would have been observed without the intercurrent event.
- A treatment-policy strategy modifies the treatment condition and potential outcome, such as comparing drug plus rescue medication as needed with placebo plus rescue medication as needed.
- Composite and while-on-treatment strategies redefine the outcome to incorporate the intercurrent event or restrict its observation period.
TC.18 Wednesday 2:45-4:15 - Recent advances in Bayesian adaptive dose finding and dose optimization designs for complex clinical trials
TC.18.01 Great Wall: A Generalized Dose Optimization Design for Drug Combination Trials Maximizing Survival Benefit (Yan Han, Indiana University School of Medicine)
The Great Wall design (Han et al. 2025) has three stages:
- Escalate dose combinations and identify those below the maximum tolerated dose contour—the “Great Wall.”
- Randomize patients among the admissible dose combinations.
- Select the dose combination that maximizes long-term survival benefit.
- The motivating concern is that a combination selected from short-term toxicity and efficacy may not maximize long-term survival.
- Simulation studies evaluated the design’s ability to identify the optimal combination.
TC.18.02 A Bayesian pharmacokinetics integrated phase II design to optimize dose-schedule regimes (Mengyi Lu, Nanjing Medical University)
Motivation:
- Both dose and schedule affect pharmacokinetic exposure, which in turn drives toxicity and efficacy.
- Gemtuzumab ozogamicin illustrated why PK-guided changes to both dose and schedule can matter.
PKIDS design (Lu et al. 2025):
- Use a Bayesian hierarchical one-compartment PK model and derive the area under the concentration-time curve analytically.
- Jointly connect PK exposure to toxicity and efficacy, with a utility function summarizing the benefit-risk trade-off.
- Adaptively randomize patients among dose-schedule regimes.
- The talk also discussed Bayesian data augmentation for delayed or partially observed toxicity and EWOC-style constraints for both safety and efficacy.
TC.18.03 A Phase I Dose-finding Design Incorporating Intra-patient Dose Escalation (Suyu Liu, The University of Texas MD Anderson Cancer Center)
Motivation:
- Conventional phase I designs generally assign one dose per patient, so each participant contributes only one dose-toxicity observation.
- Intra-patient escalation can improve patient access to active doses and generate more information in rare-disease and pediatric settings.
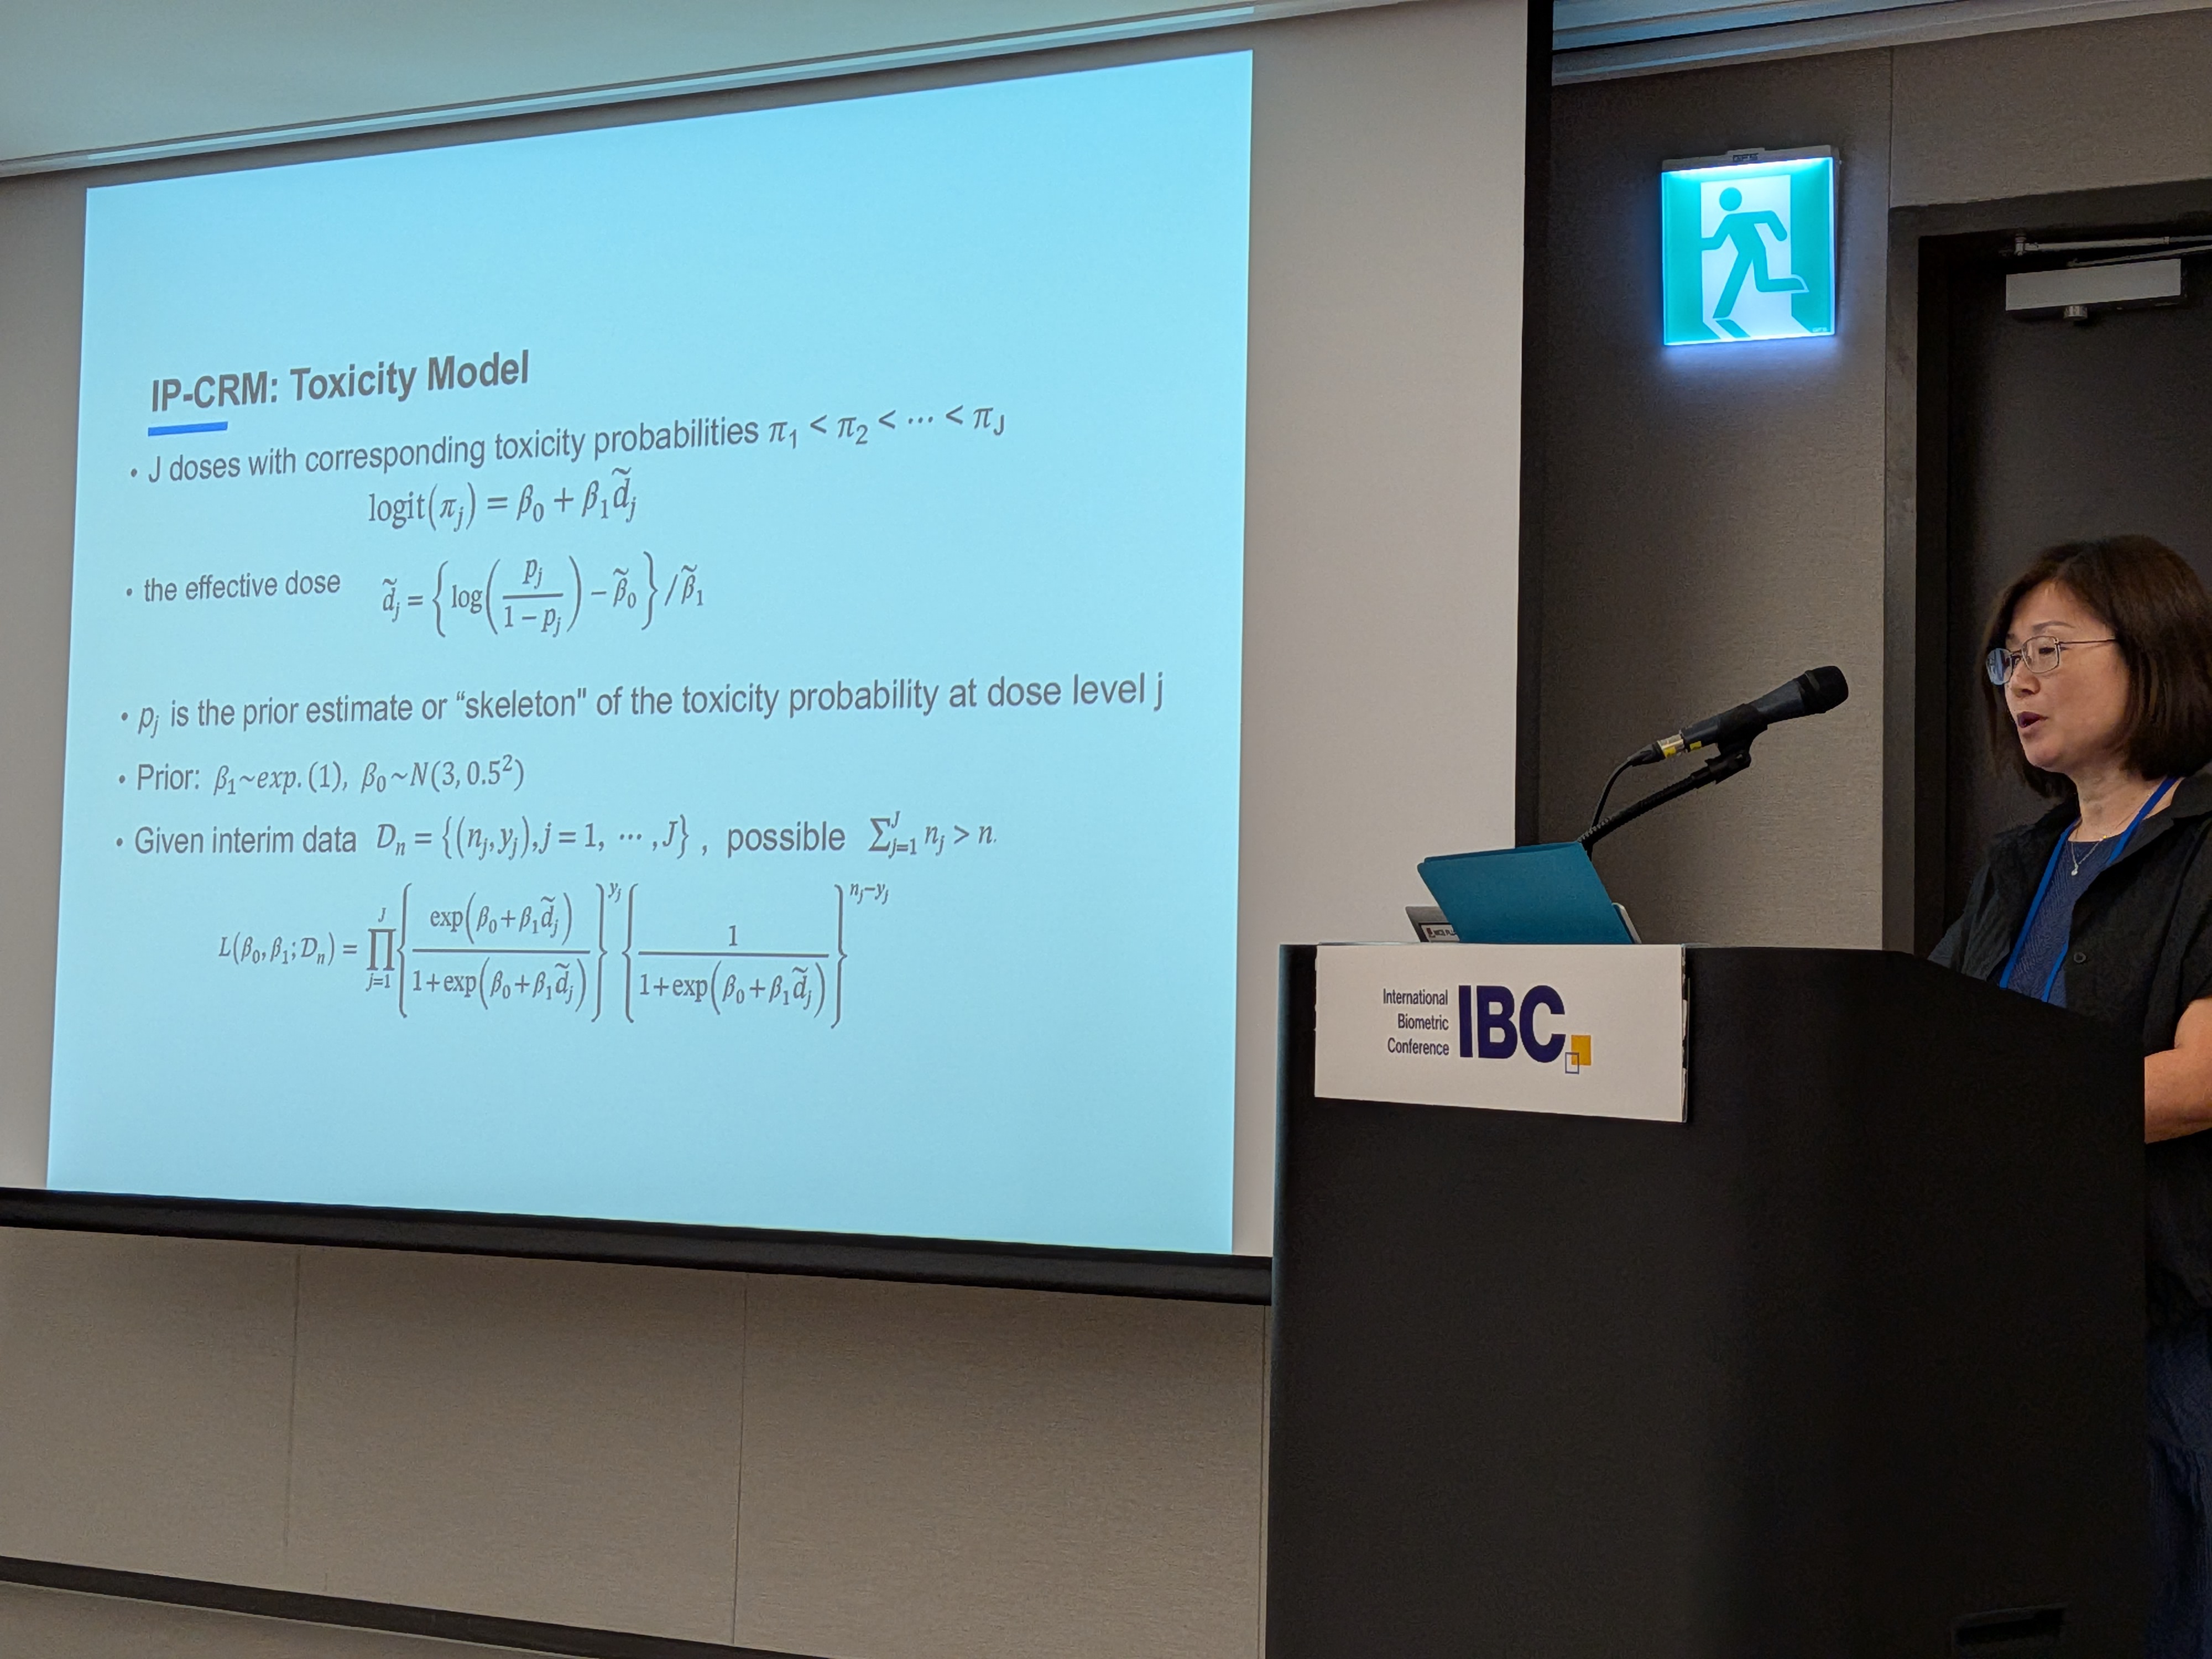
IP-CRM (Guo and Liu 2025):
- Combine the continual reassessment method with a prespecified skeleton and allow each patient to receive up to \(K\) doses.
- Adaptively update the starting dose for each new cohort using all accumulated data.
- Extensions incorporate carry-over effects and within-patient correlation; the talk highlighted sensitivity analysis because these assumptions are consequential.
TC.18.04 Precision Generalized Phase I-II Designs (Yong Zang, Indiana University School of Medicine)
Motivation:
- Short-term toxicity and efficacy may be imperfect surrogates for long-term treatment success, particularly in heterogeneous cell-therapy populations.
PGen I-II design (Zhao et al. 2025):
- Model short-term toxicity and efficacy jointly with latent multivariate probit variables.
- Use an Emax model for short-term efficacy and a piecewise exponential model for long-term failure or survival, including both indirect and direct effects of dose.
- Adaptively cluster prognostic or biomarker subgroups and borrow information within clusters.
Three stages:
- Conduct an initial conventional phase I escalation without subgroup-specific decisions.
- Randomize patients among admissible doses.
- Select a subgroup-specific optimal dose using short- and long-term outcomes.
TC.18.05 A Pharmacokinetics-Informed Bayesian Design for Dose Optimization in Multi-Regional Clinical Trials (Fangrong Yan, China Pharmaceutical University)
Setting:
- After a first-in-human study, compare two doses within each of several regions while allowing regional heterogeneity.
Proposal:
- Use a Gumbel model to describe dependence between safety and efficacy.
- Construct separate Bayesian hierarchical models for the efficacy and safety components.
- Use likelihood-ratio comparisons to choose between strong- and weak-borrowing models.
Result:
- The reported simulations showed improved identification of region-specific optimal biological doses.
TC.13 Wednesday 4:30-6:00 - Novel Bayesian designs for early phase clinical trials
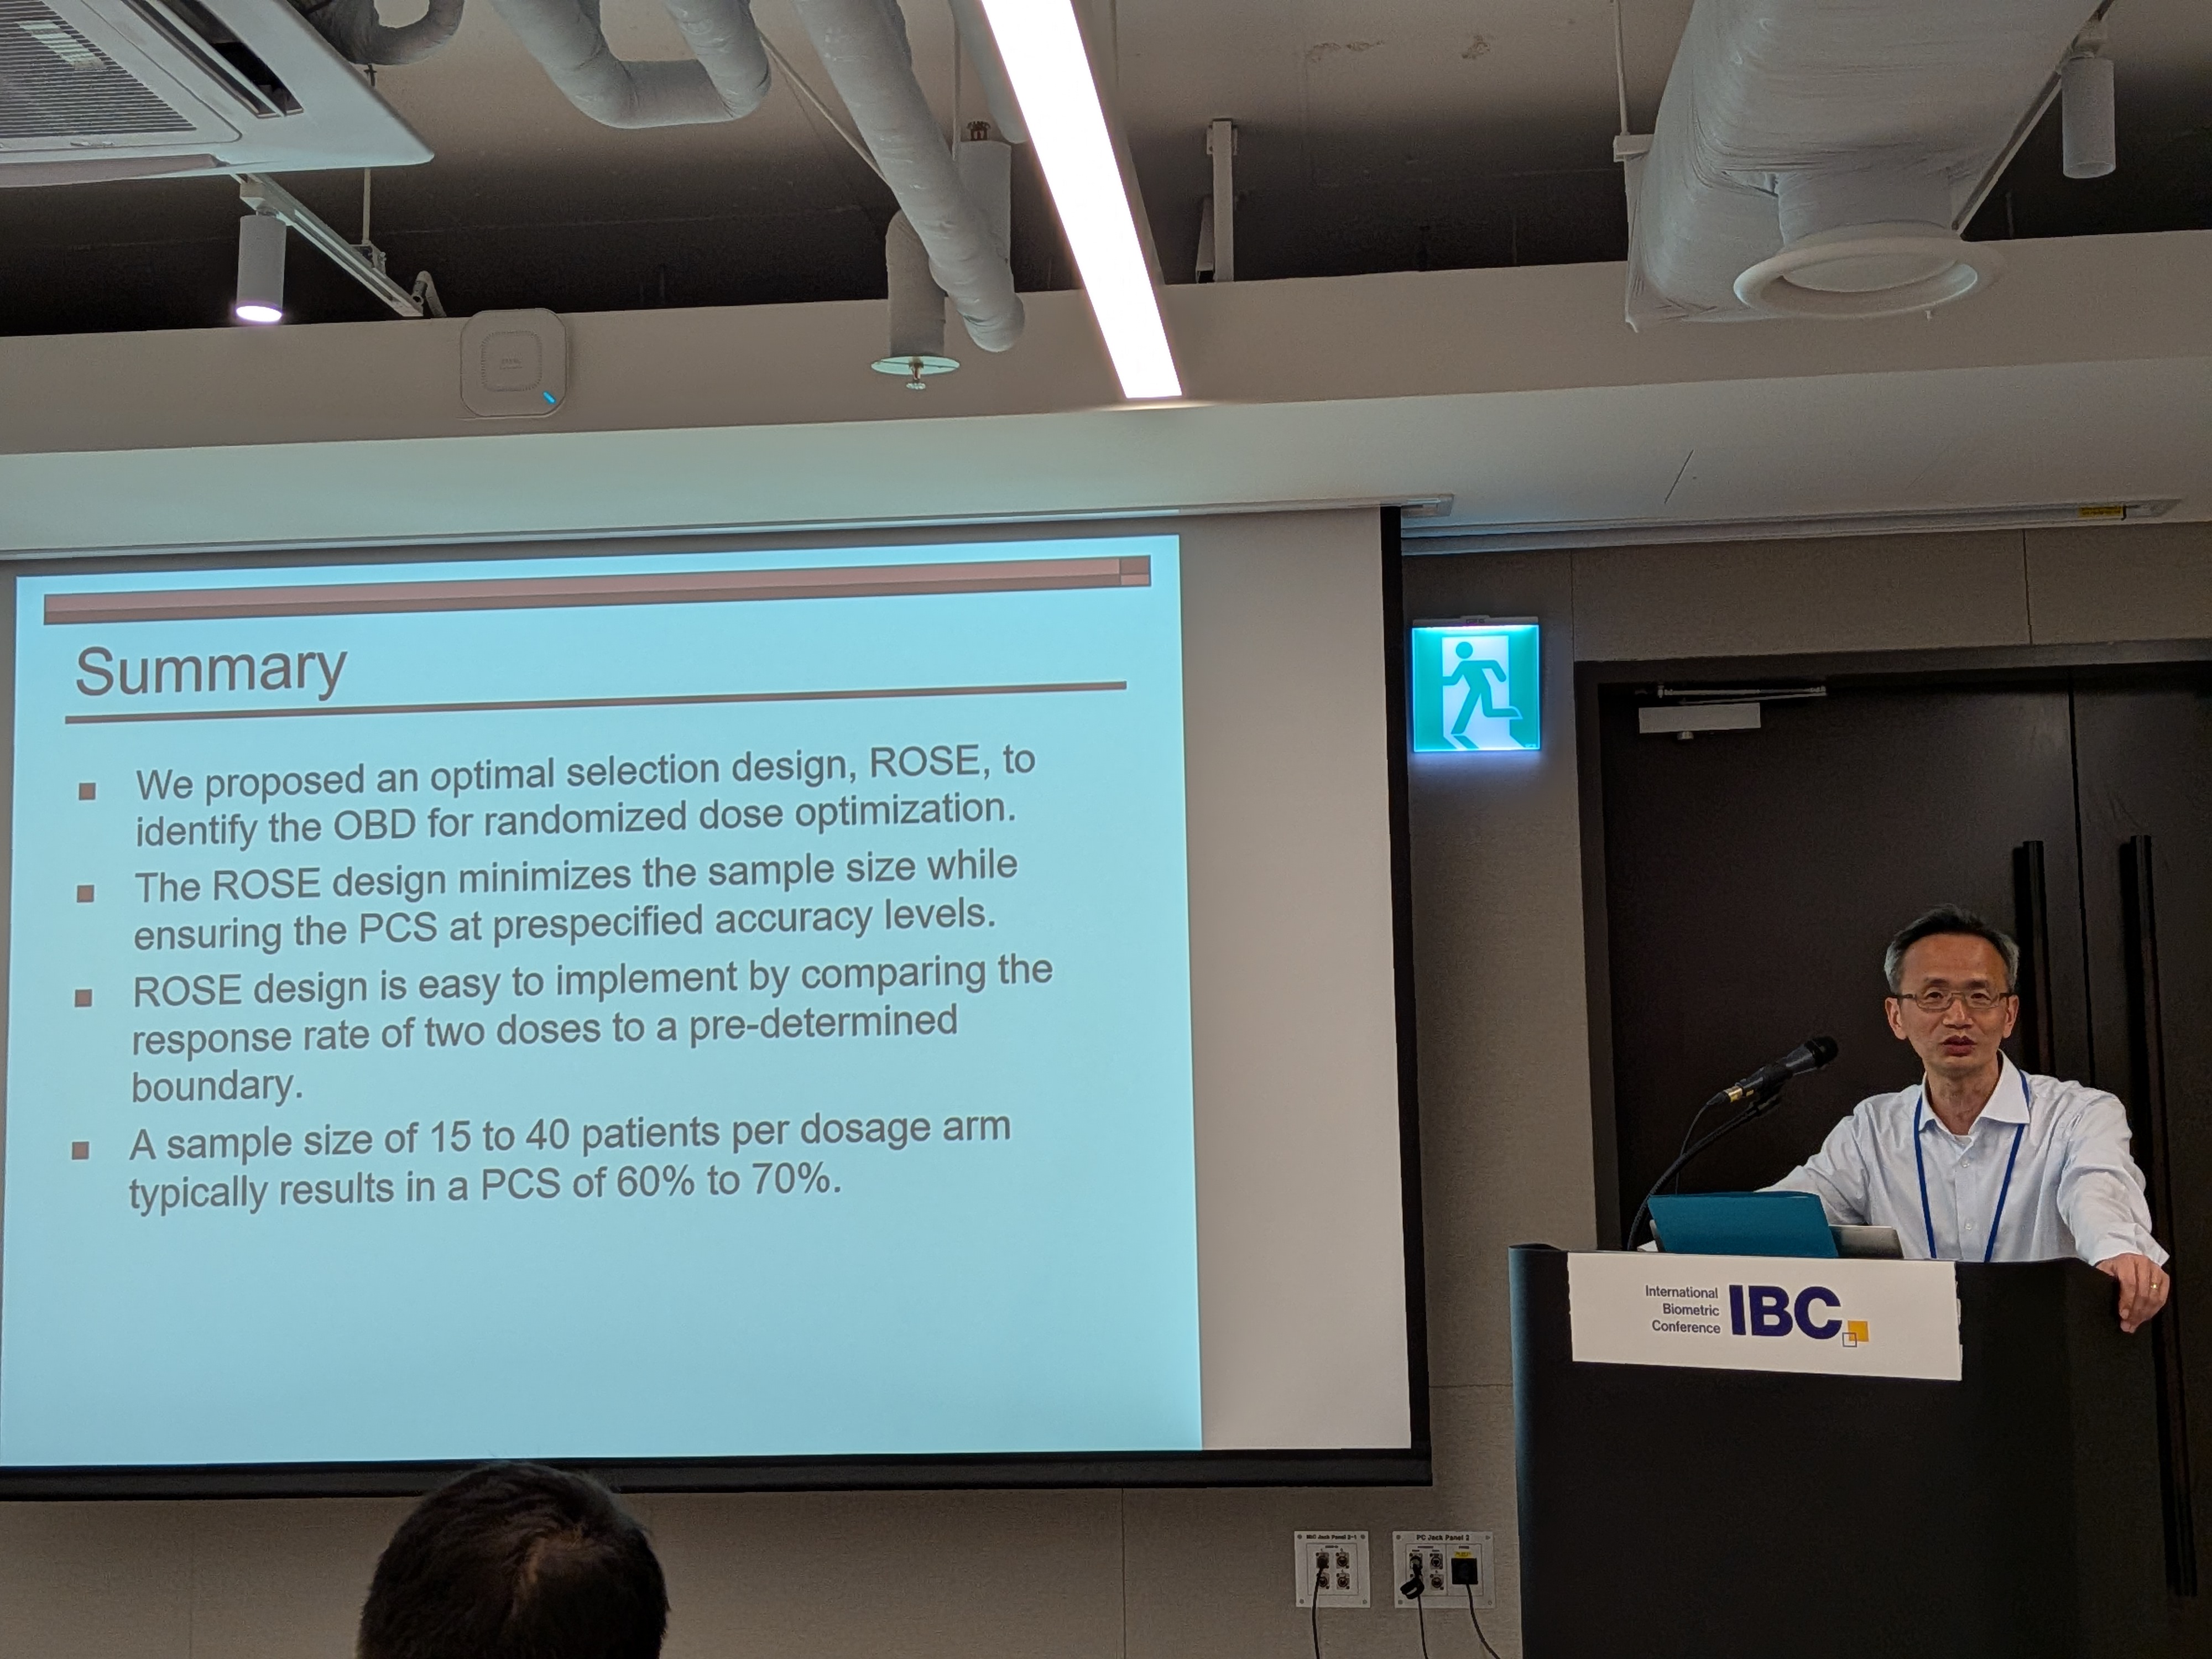
TC.13.01 Randomized Optimal Selection Design for Dose Optimization (Ying Yuan, The University of Texas MD Anderson Cancer Center)
Motivation:
- A randomized dose-optimization study is a selection problem rather than a conventional hypothesis-testing problem, so standard type I error and power calculations do not directly determine its sample size.
ROSE design (Wang et al. 2025):
- Randomize patients between a lower and higher candidate dose.
- Select the lower dose when the estimated response-rate difference is below a decision boundary \(\lambda\); otherwise select the higher dose because efficacy may not yet have plateaued.
- Specify a clinically meaningful difference \(\delta\) and a target probability of correct selection (PCS).
- The decision boundary and sample size are chosen to minimize sample size subject to the PCS requirement.
- The operating characteristics can be explored with the ROSE web application.
TC.13.02 Calibration-free odds design (CFO) for minimum noninferiority dose (Guosheng Yin, University of Hong Kong)
Motivation:
- For expensive or difficult-to-manufacture treatments such as CAR T-cell therapy, the aim may be the smallest dose that retains nearly all efficacy of the optimal biological dose rather than the OBD itself.
Two-stage CFO-MND design (Zhang and Yin 2026):
- Use the calibration-free odds design (Jin and Yin 2022) to monitor toxicity and form an admissible set.
- Use response-adaptive randomization to identify the minimum noninferiority dose, for example one retaining at least 90% of the OBD’s efficacy while reducing dose.
- CFO compares posterior odds of excessive versus acceptable toxicity to choose escalation or de-escalation without calibrating a dose-toxicity model.
- A placebo-equivalent dose, potentially the starting dose or a lower fraction of it, anchors a preliminary estimate of the average treatment effect.
- The CFO R package provides implementations of CFO-family designs.
TC.13.04 Optimizing Pediatric Dose Finding: A Phase I/II Design Integrating Adult Data (Liyun Jiang, China Pharmaceutical University)
Motivation:
- Pediatric trials face limited recruitment and ethical constraints, while relevant adult safety and efficacy data may already exist.
Proposal (Liu et al. 2026):
- Extend BOIN12 to
pp-BOIN12and TITE-BOIN12 topp-TITE-BOIN12using a power-prior framework. - Estimate dose-specific borrowing weights from the Hellinger distance between the adult and pediatric data rather than assigning a prior distribution to the weight.
- Apply joint safety and efficacy admissibility criteria to identify the optimal biological dose.
- Use additional suspension rules in the time-to-event version when too much follow-up remains pending.
Results:
- The designs improved OBD selection and overdose control in reported simulations; the time-to-event extension shortened trial duration while retaining similar accuracy.
OP.56 Wednesday 10:15-11:45 - Categorical Data Models and Methods
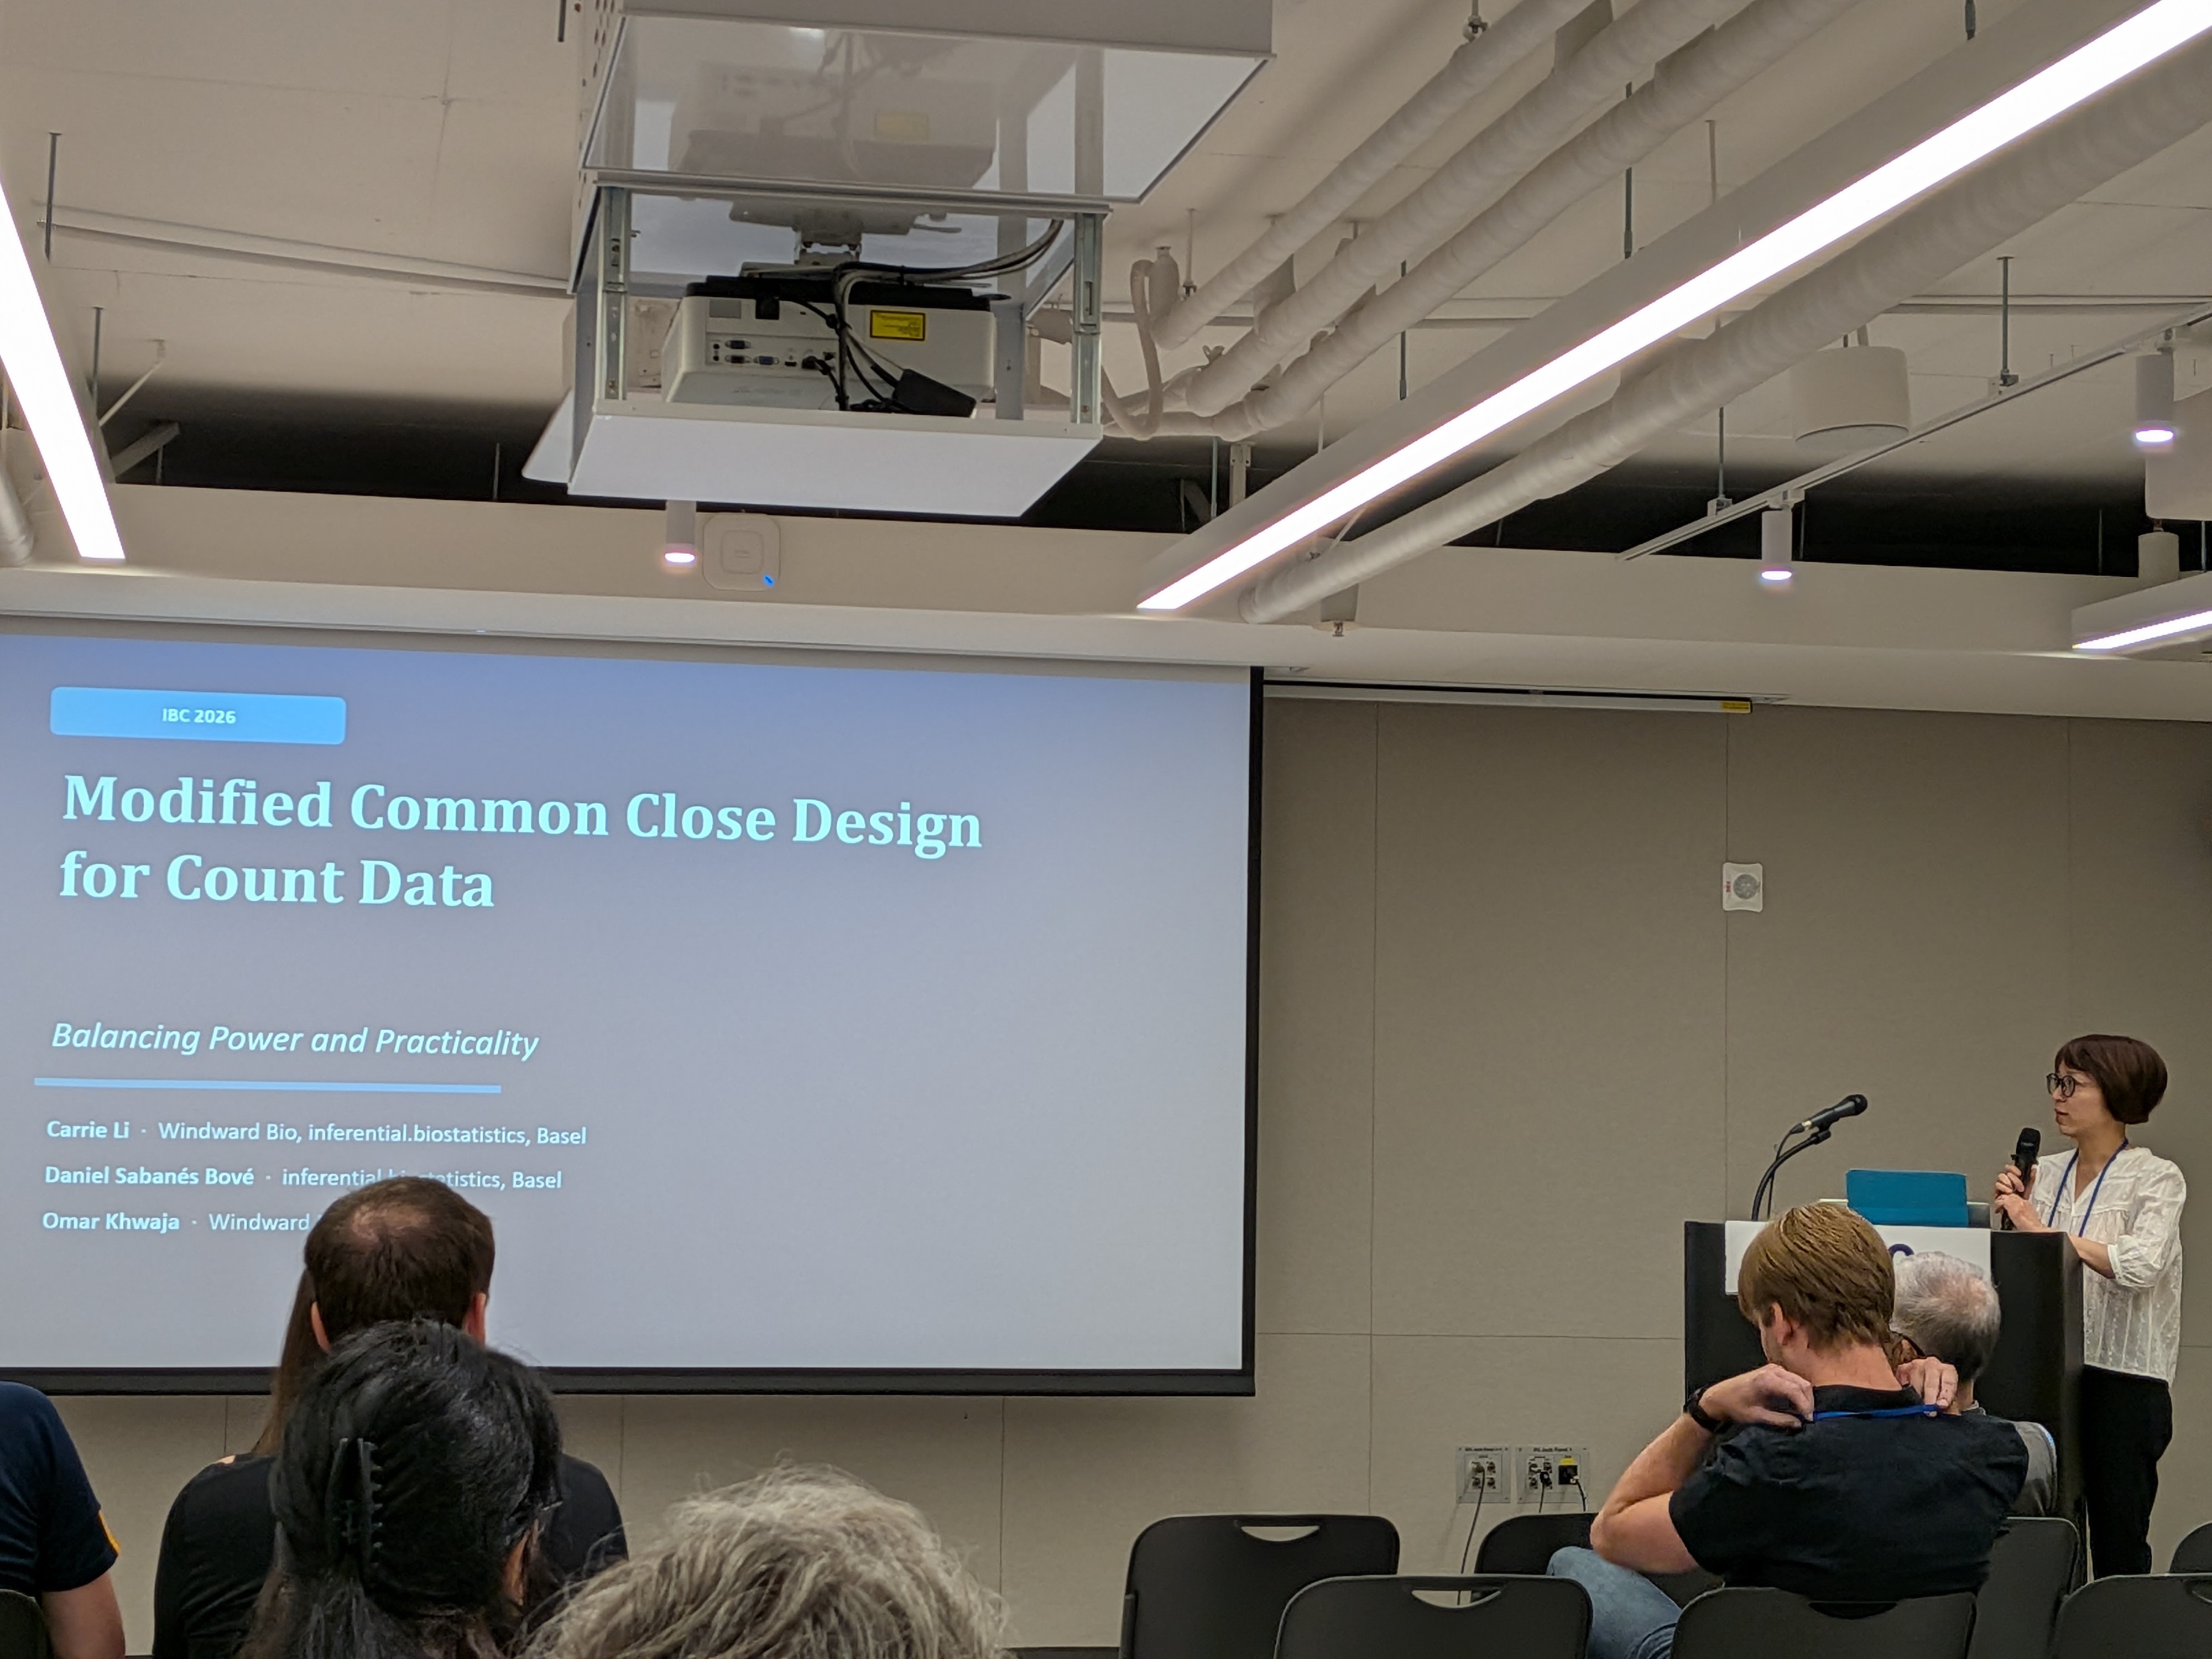
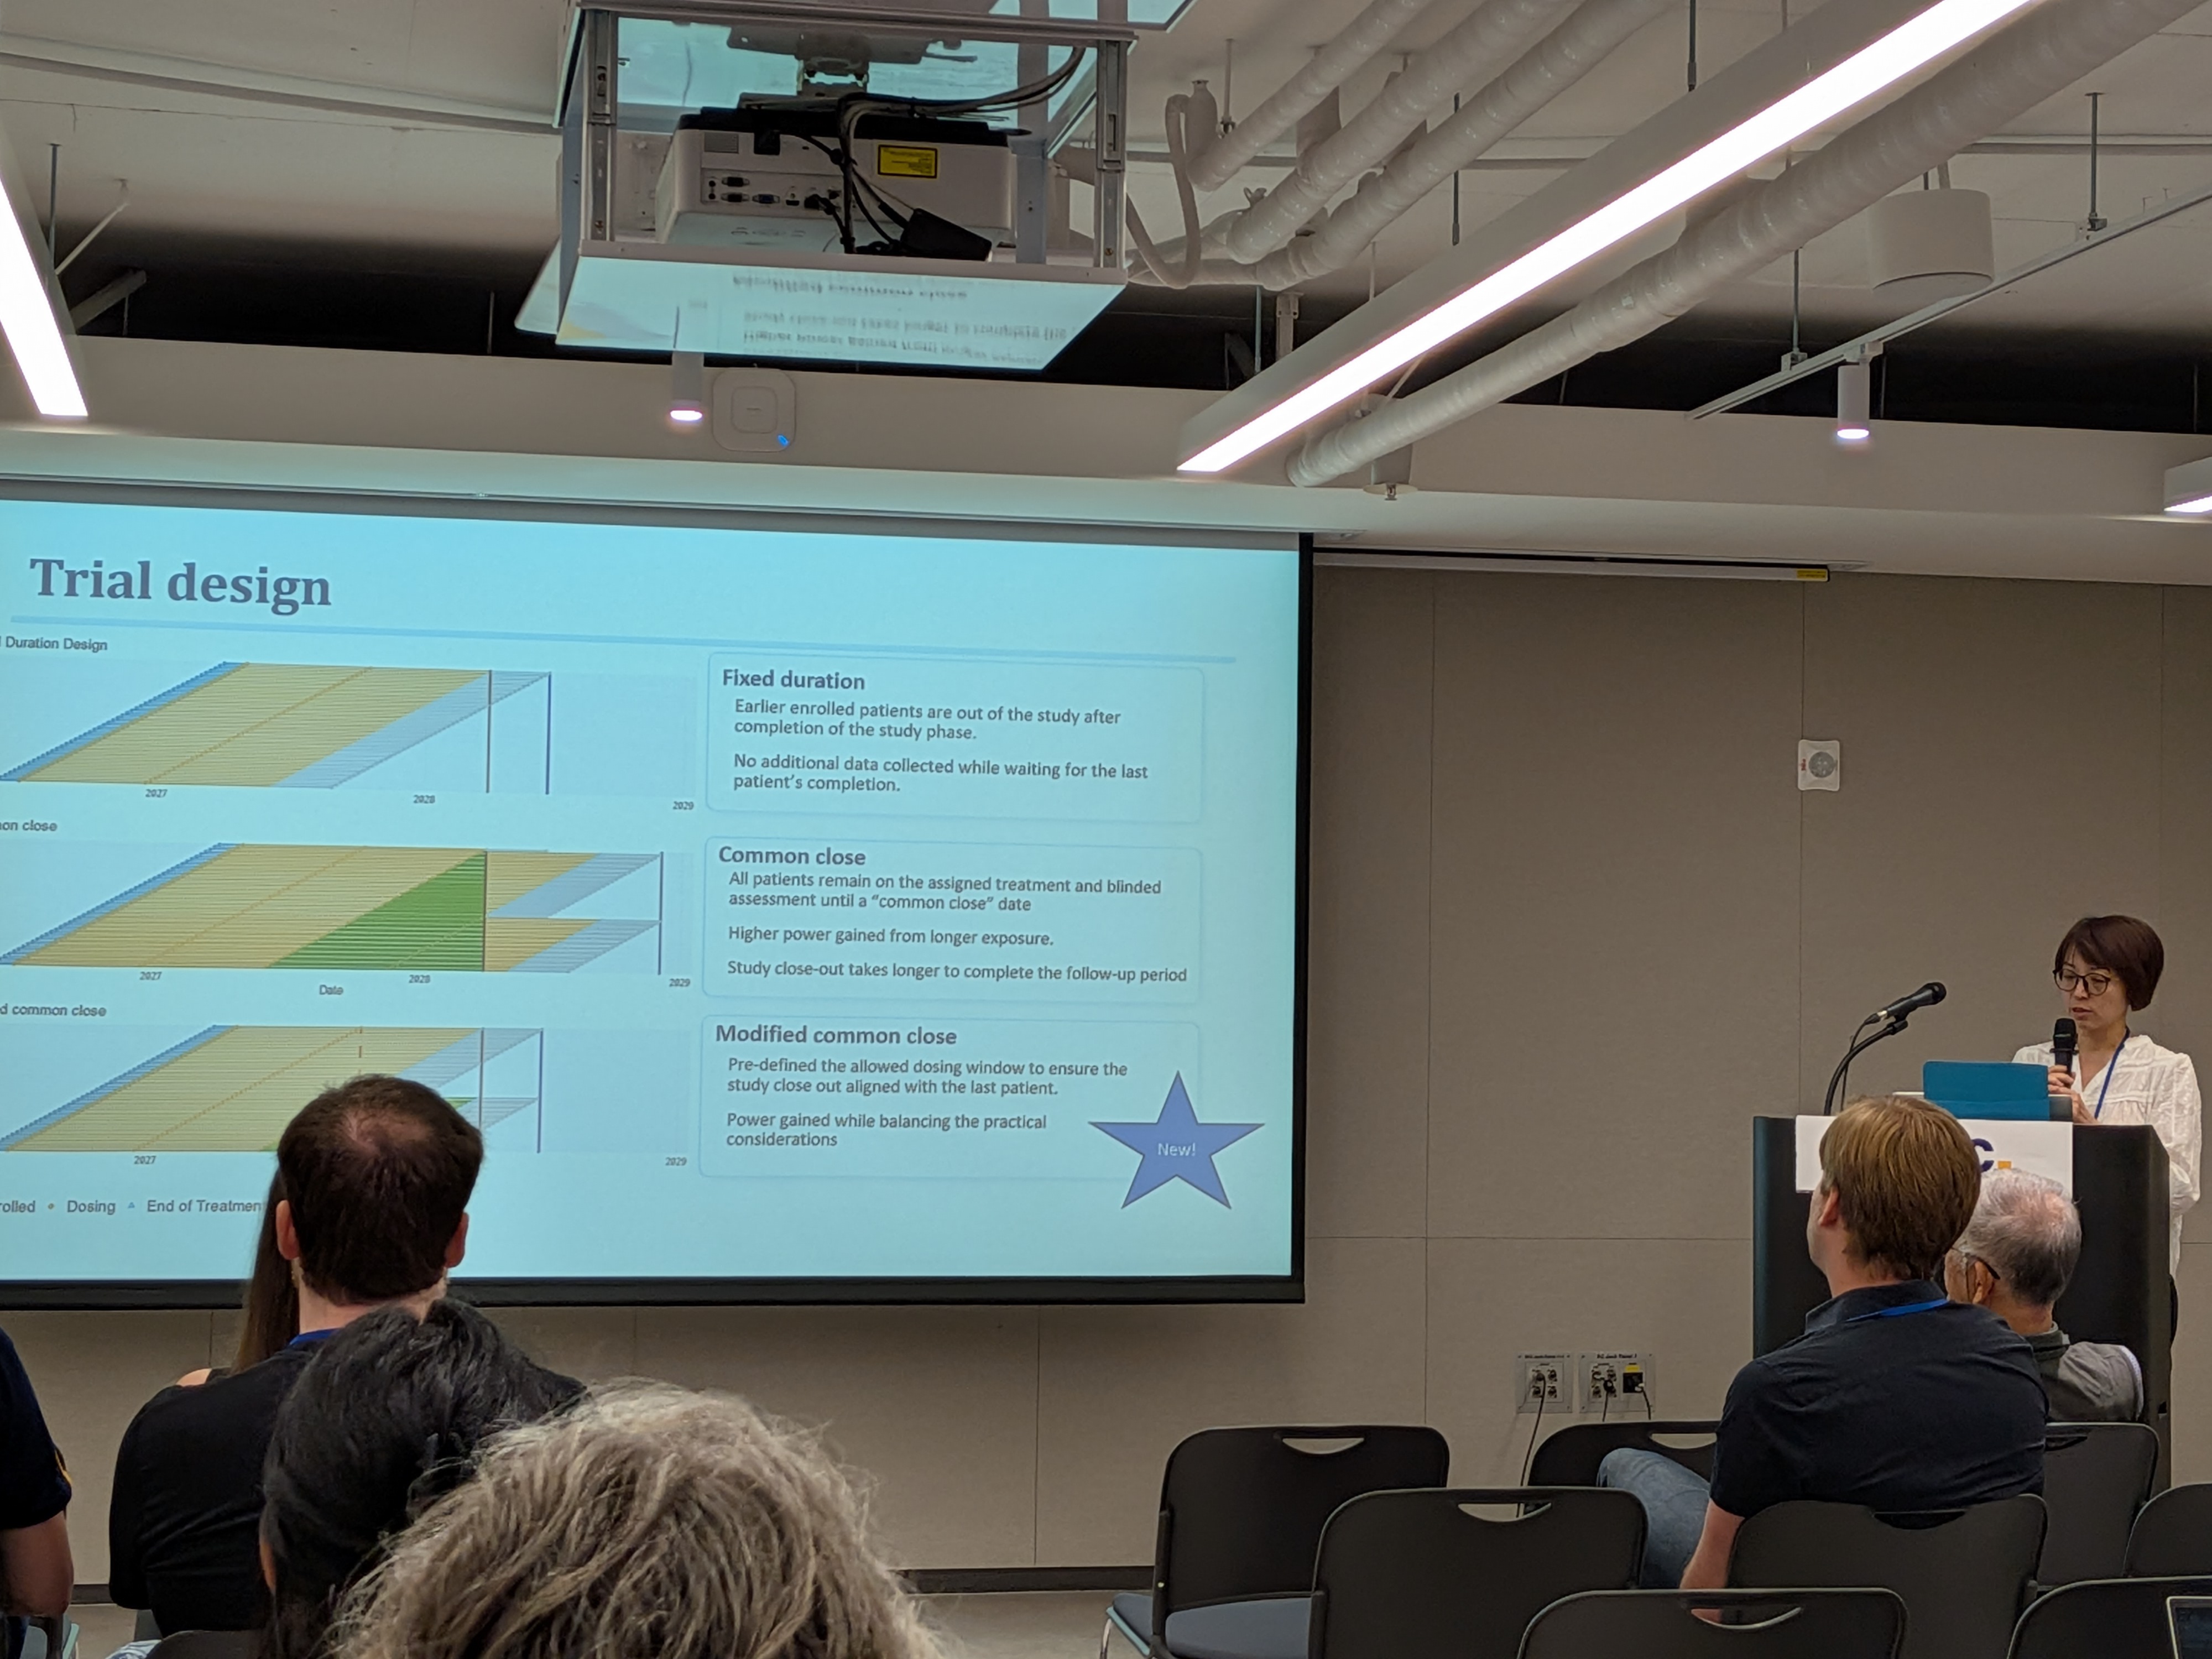
OP.56.02 Modified Common Close Design for Count Data (Carrie Li, Windward Bio)
Keynote impressions
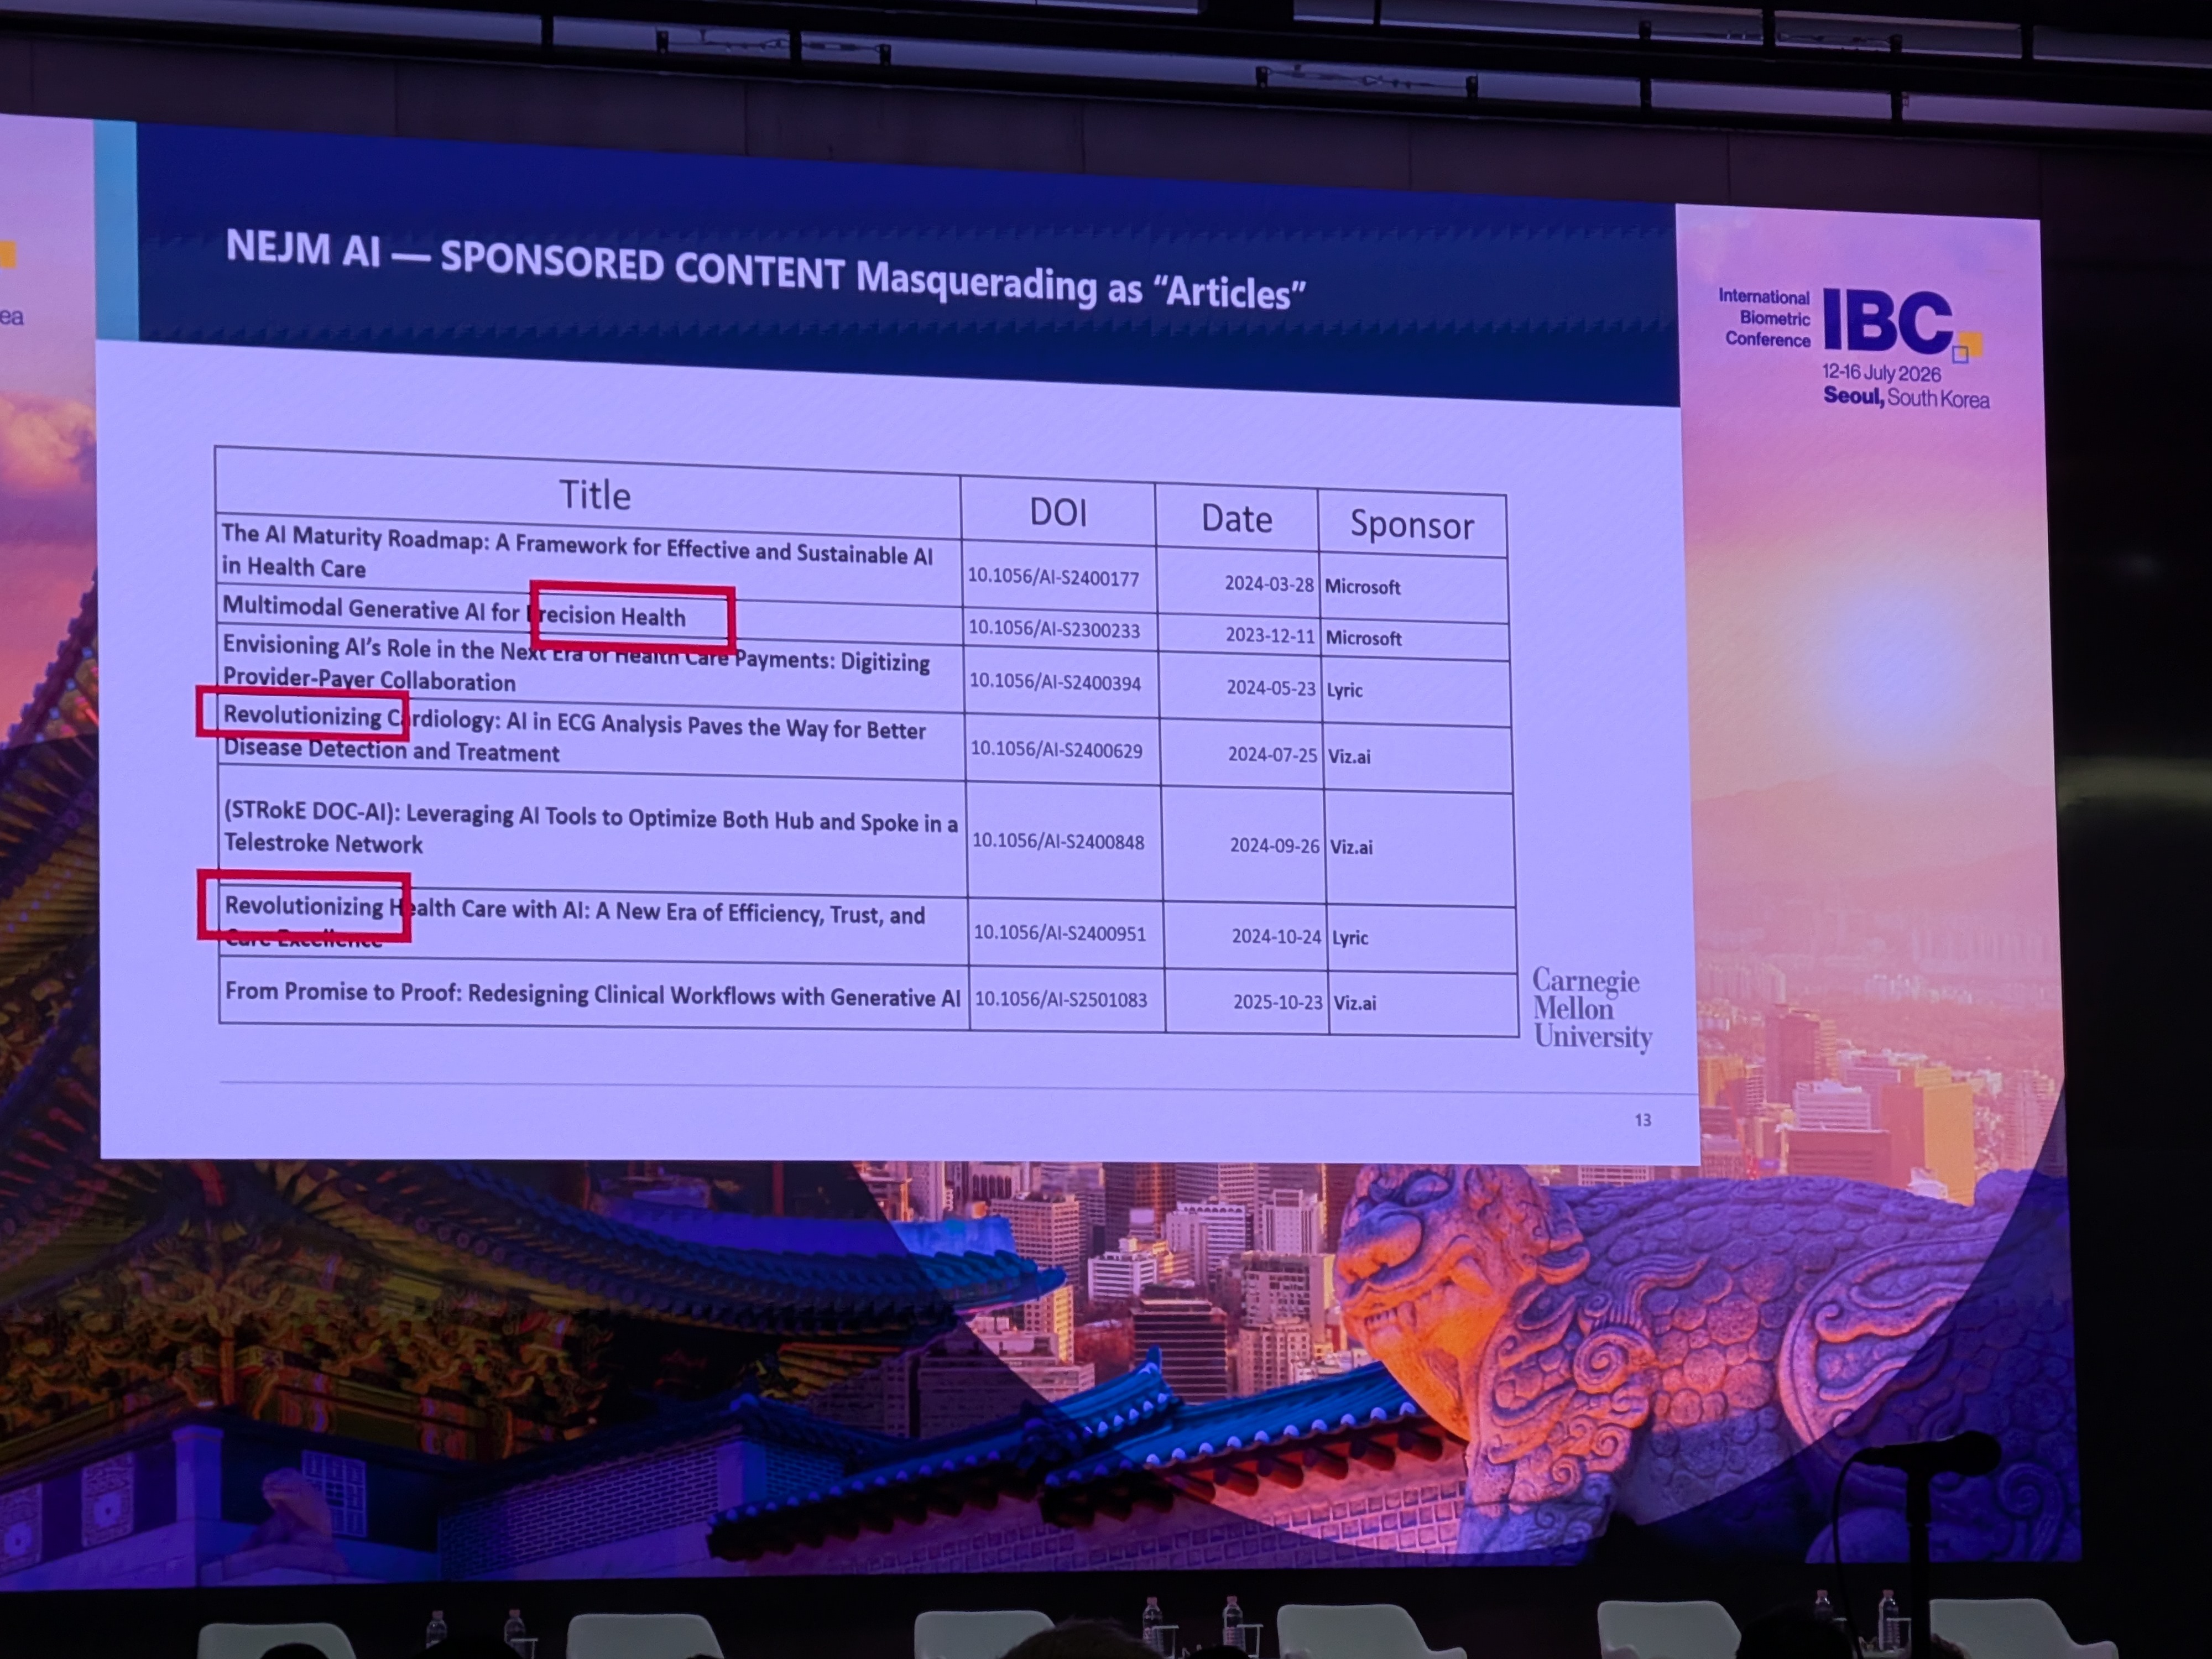


Selected Posters
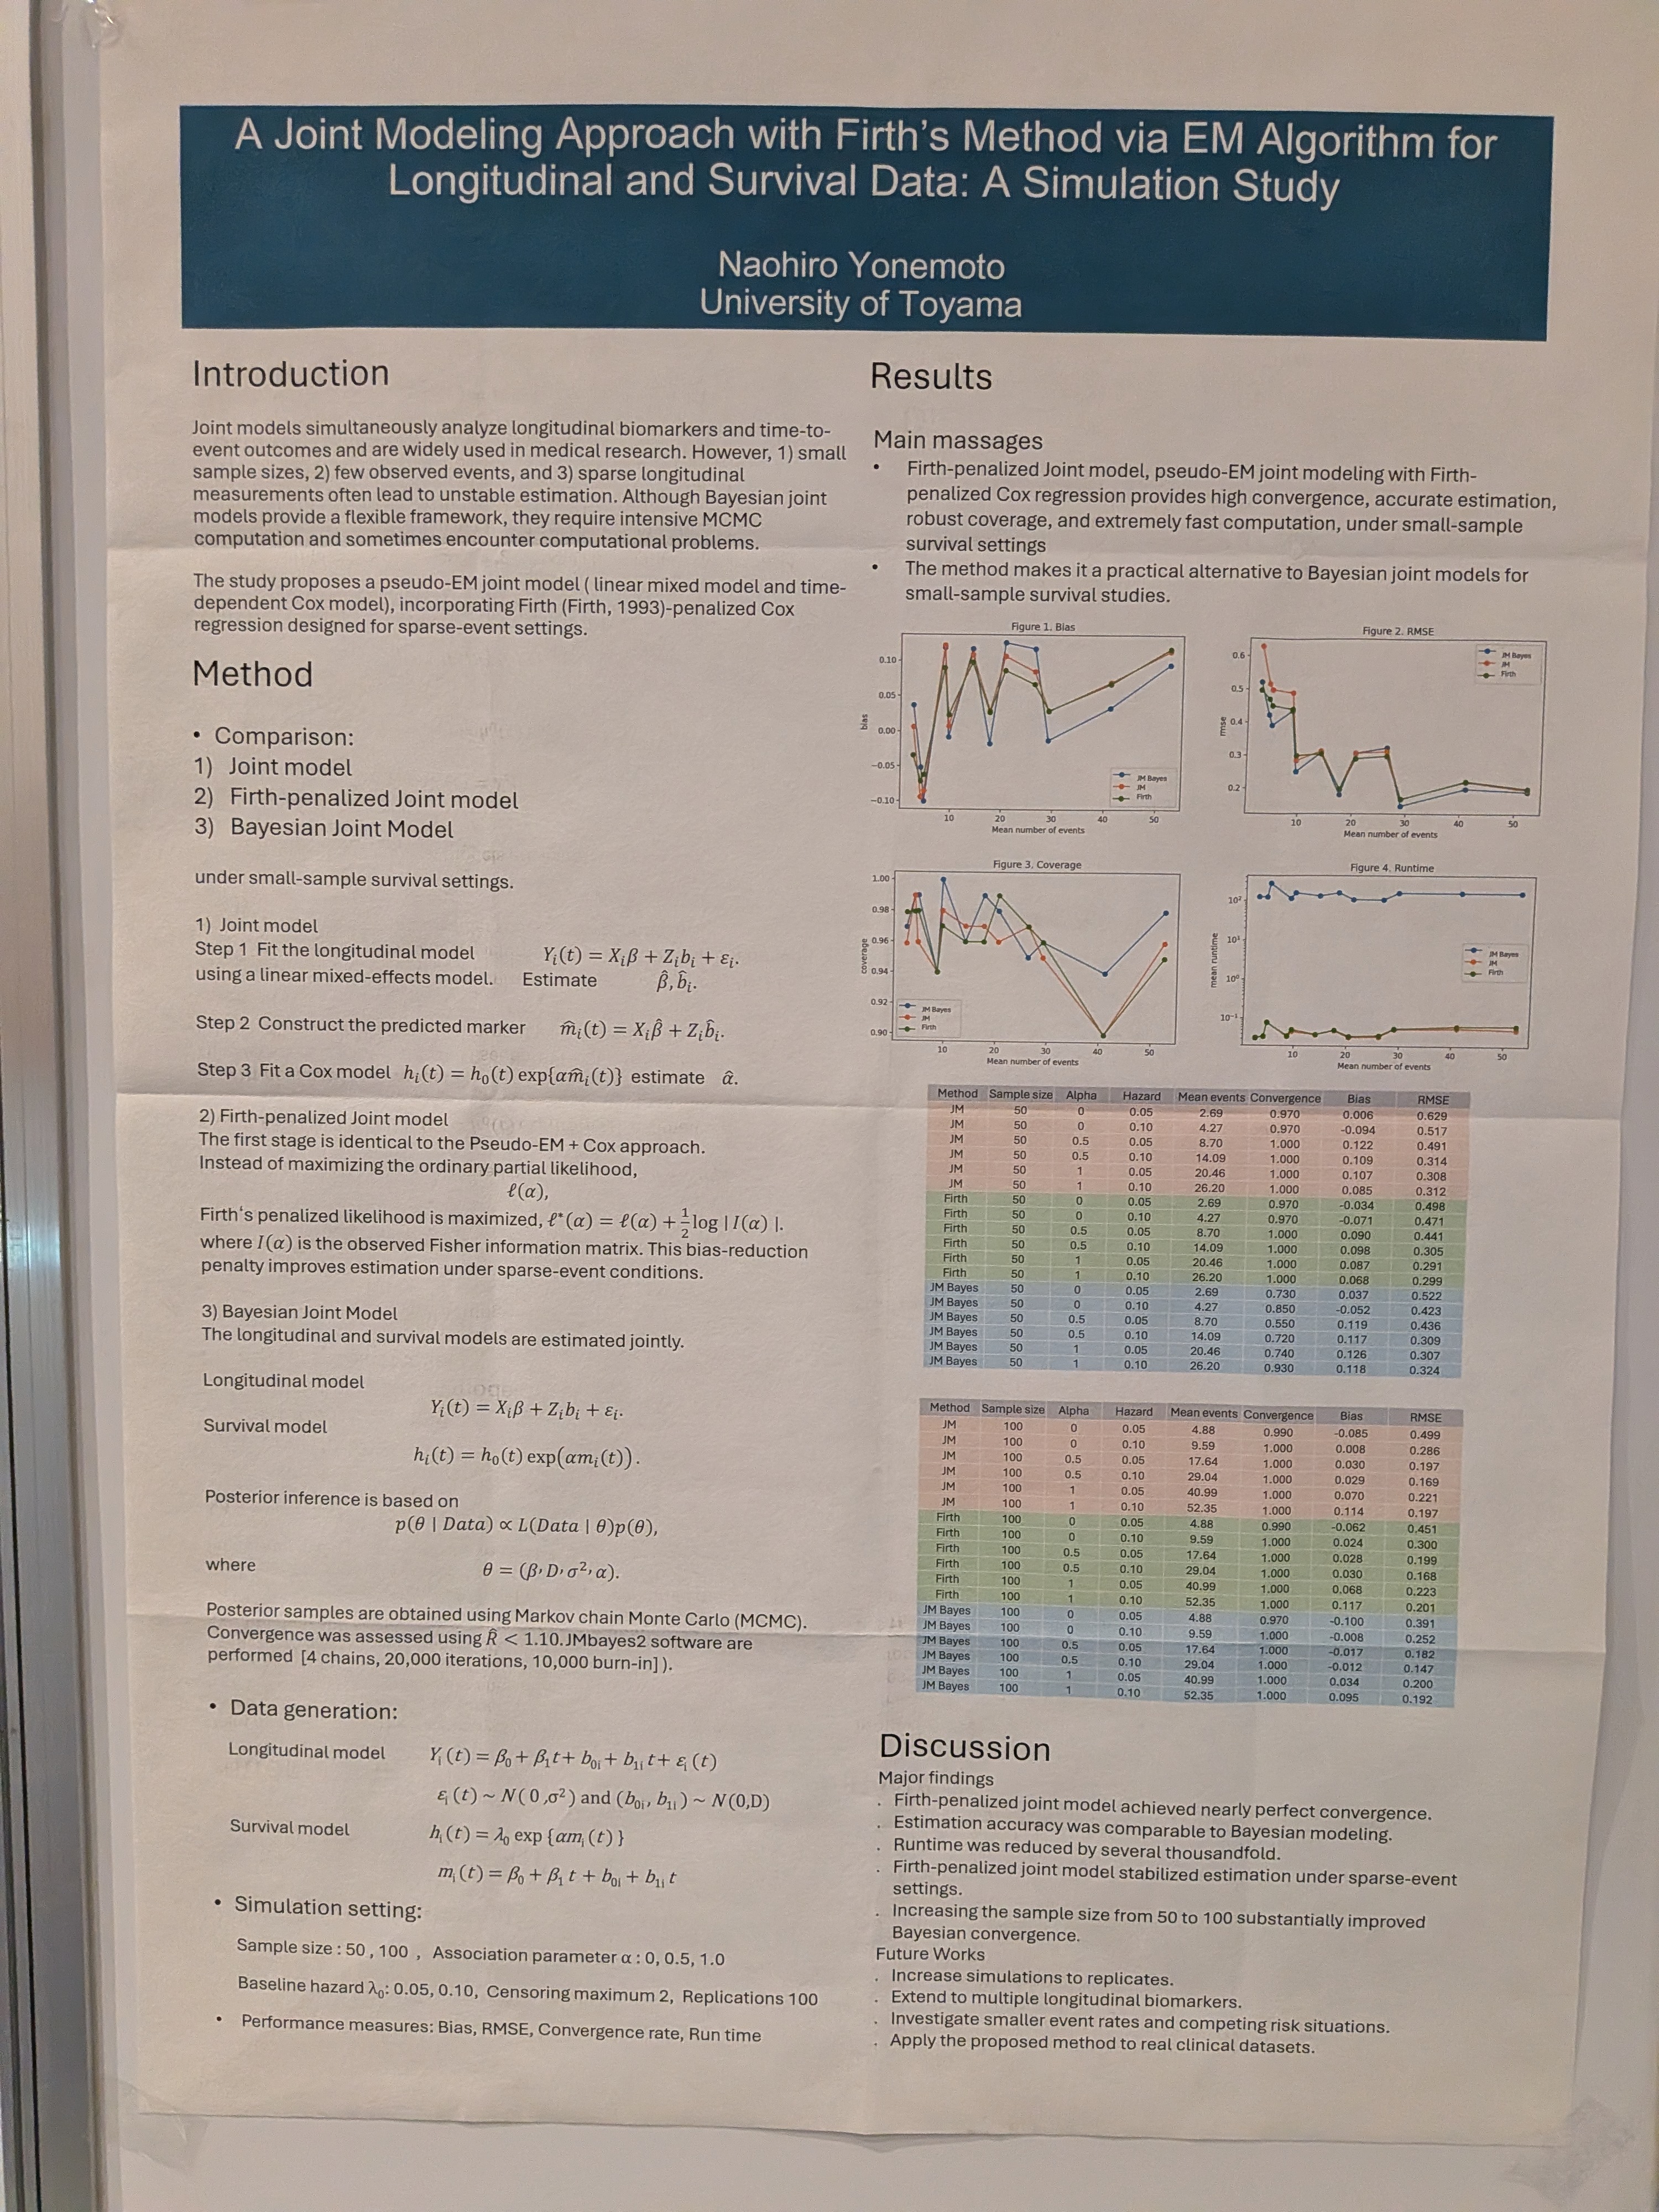
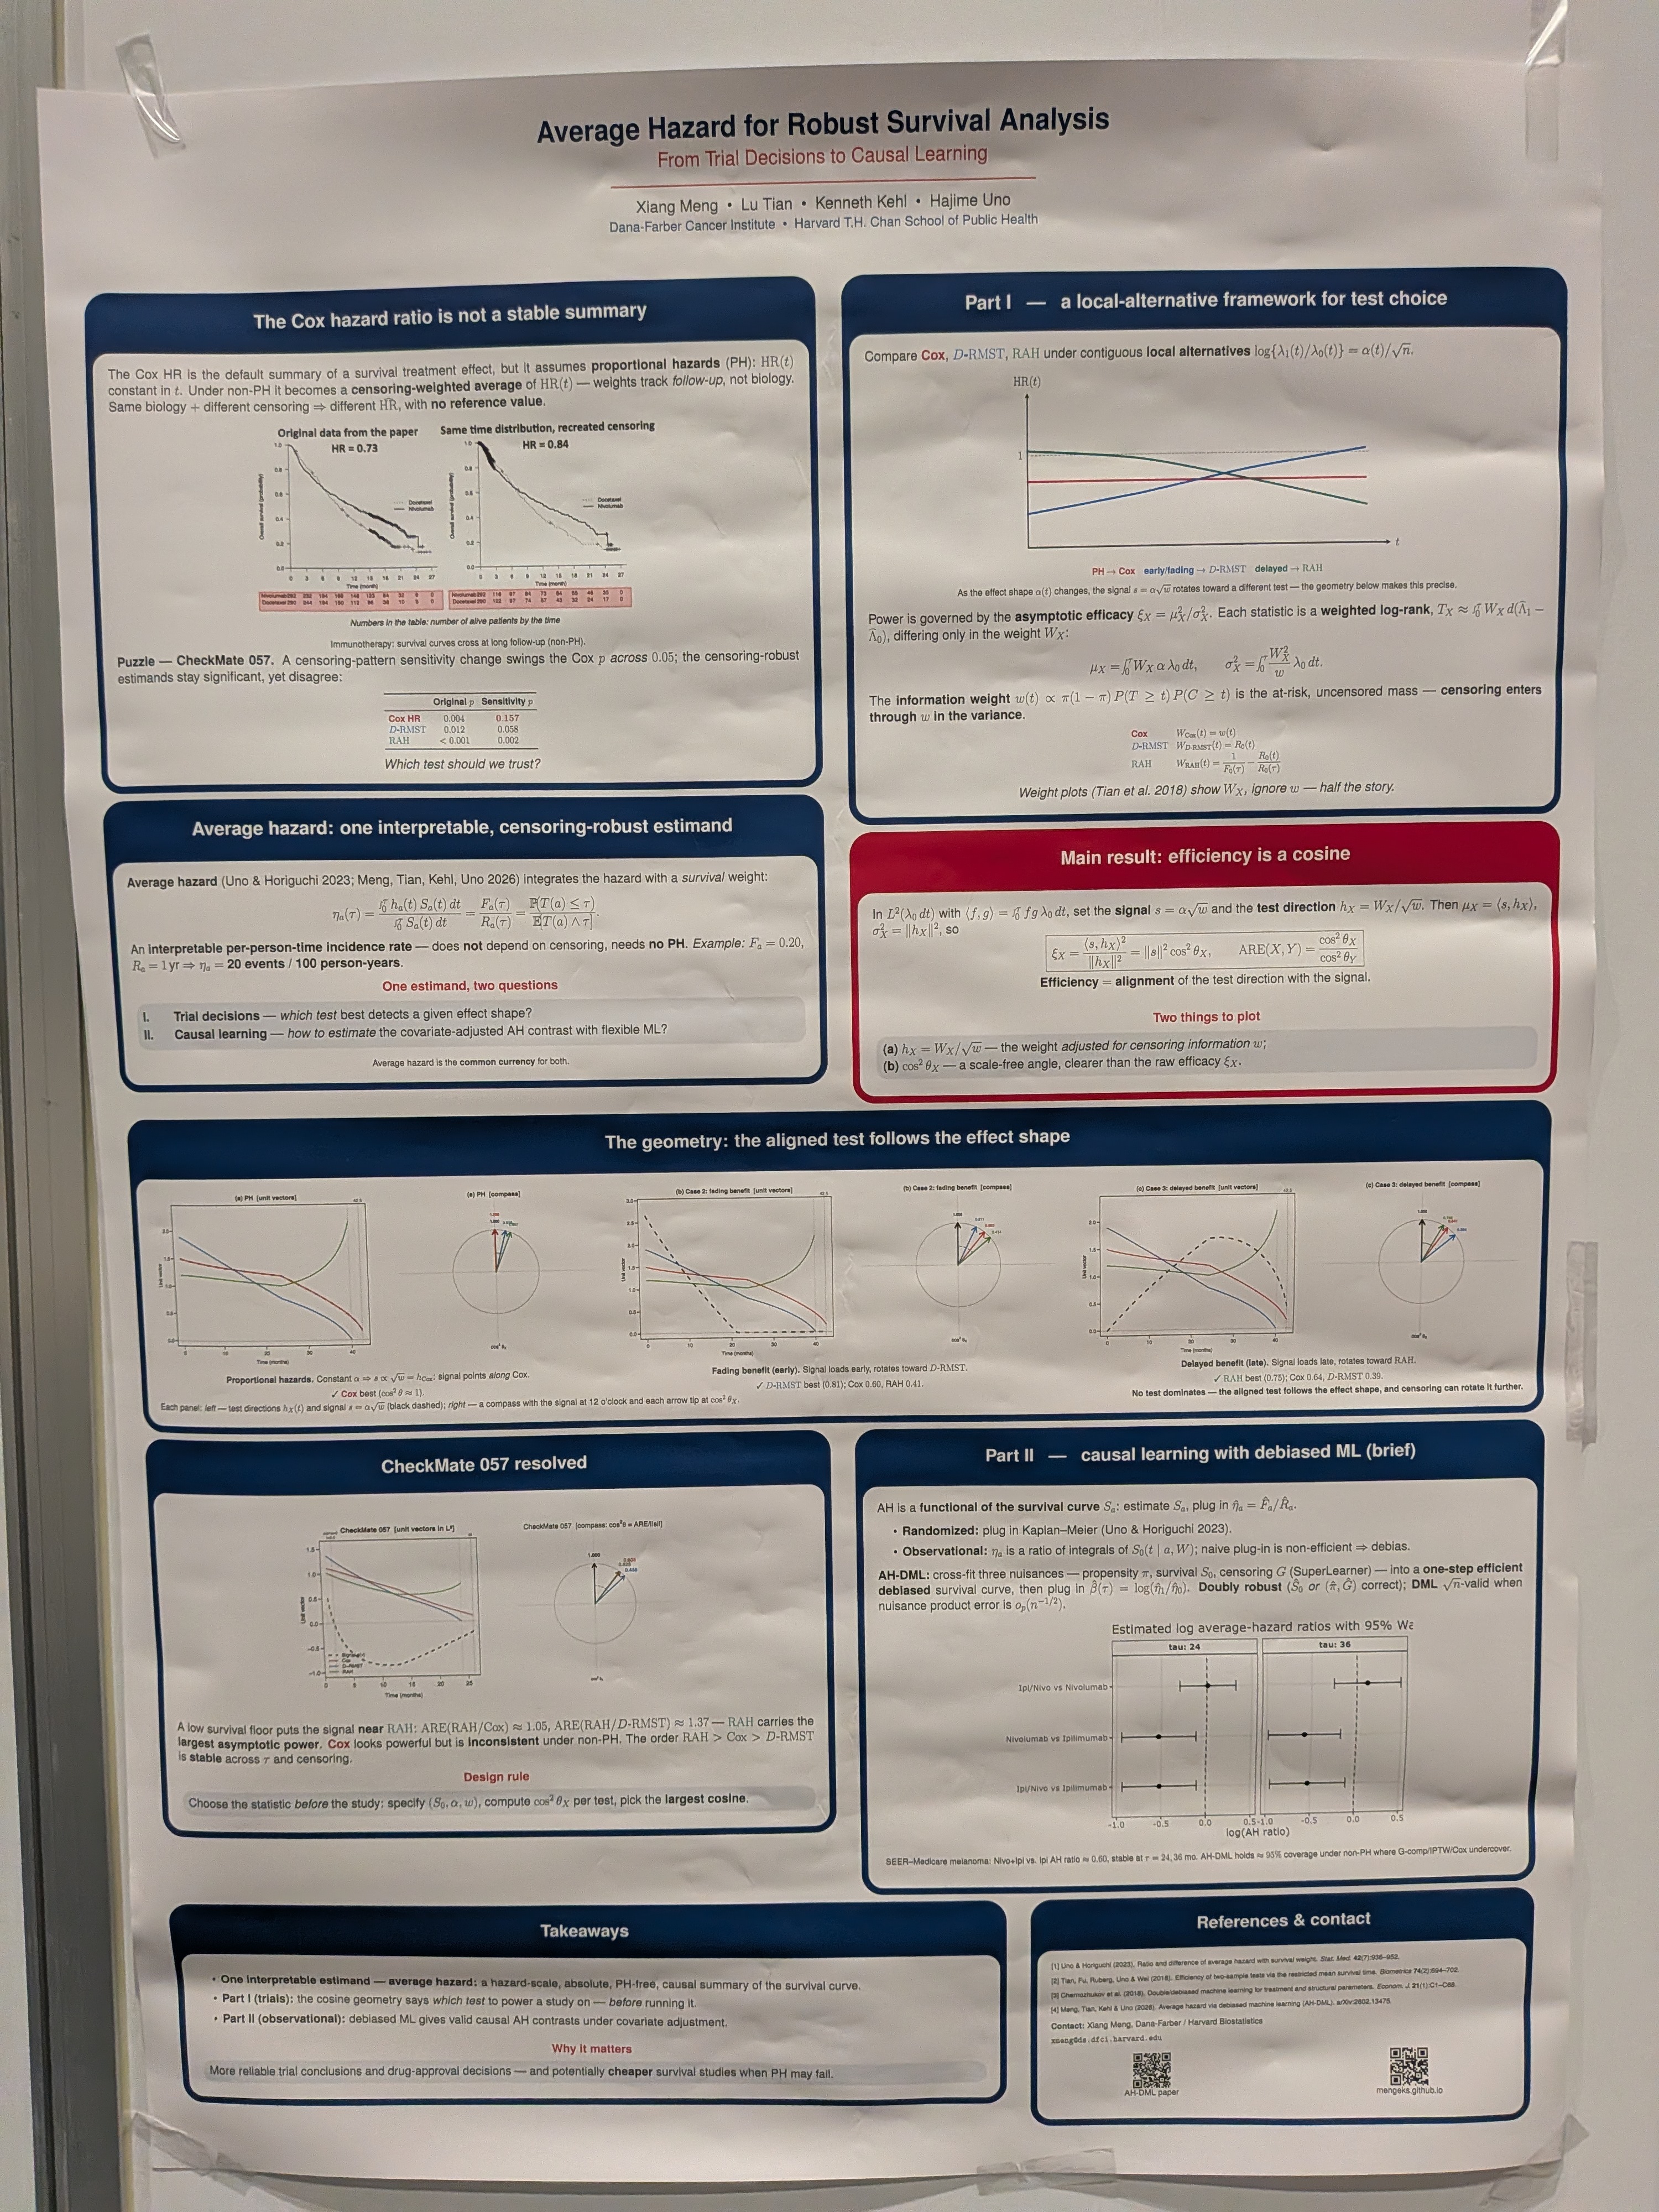
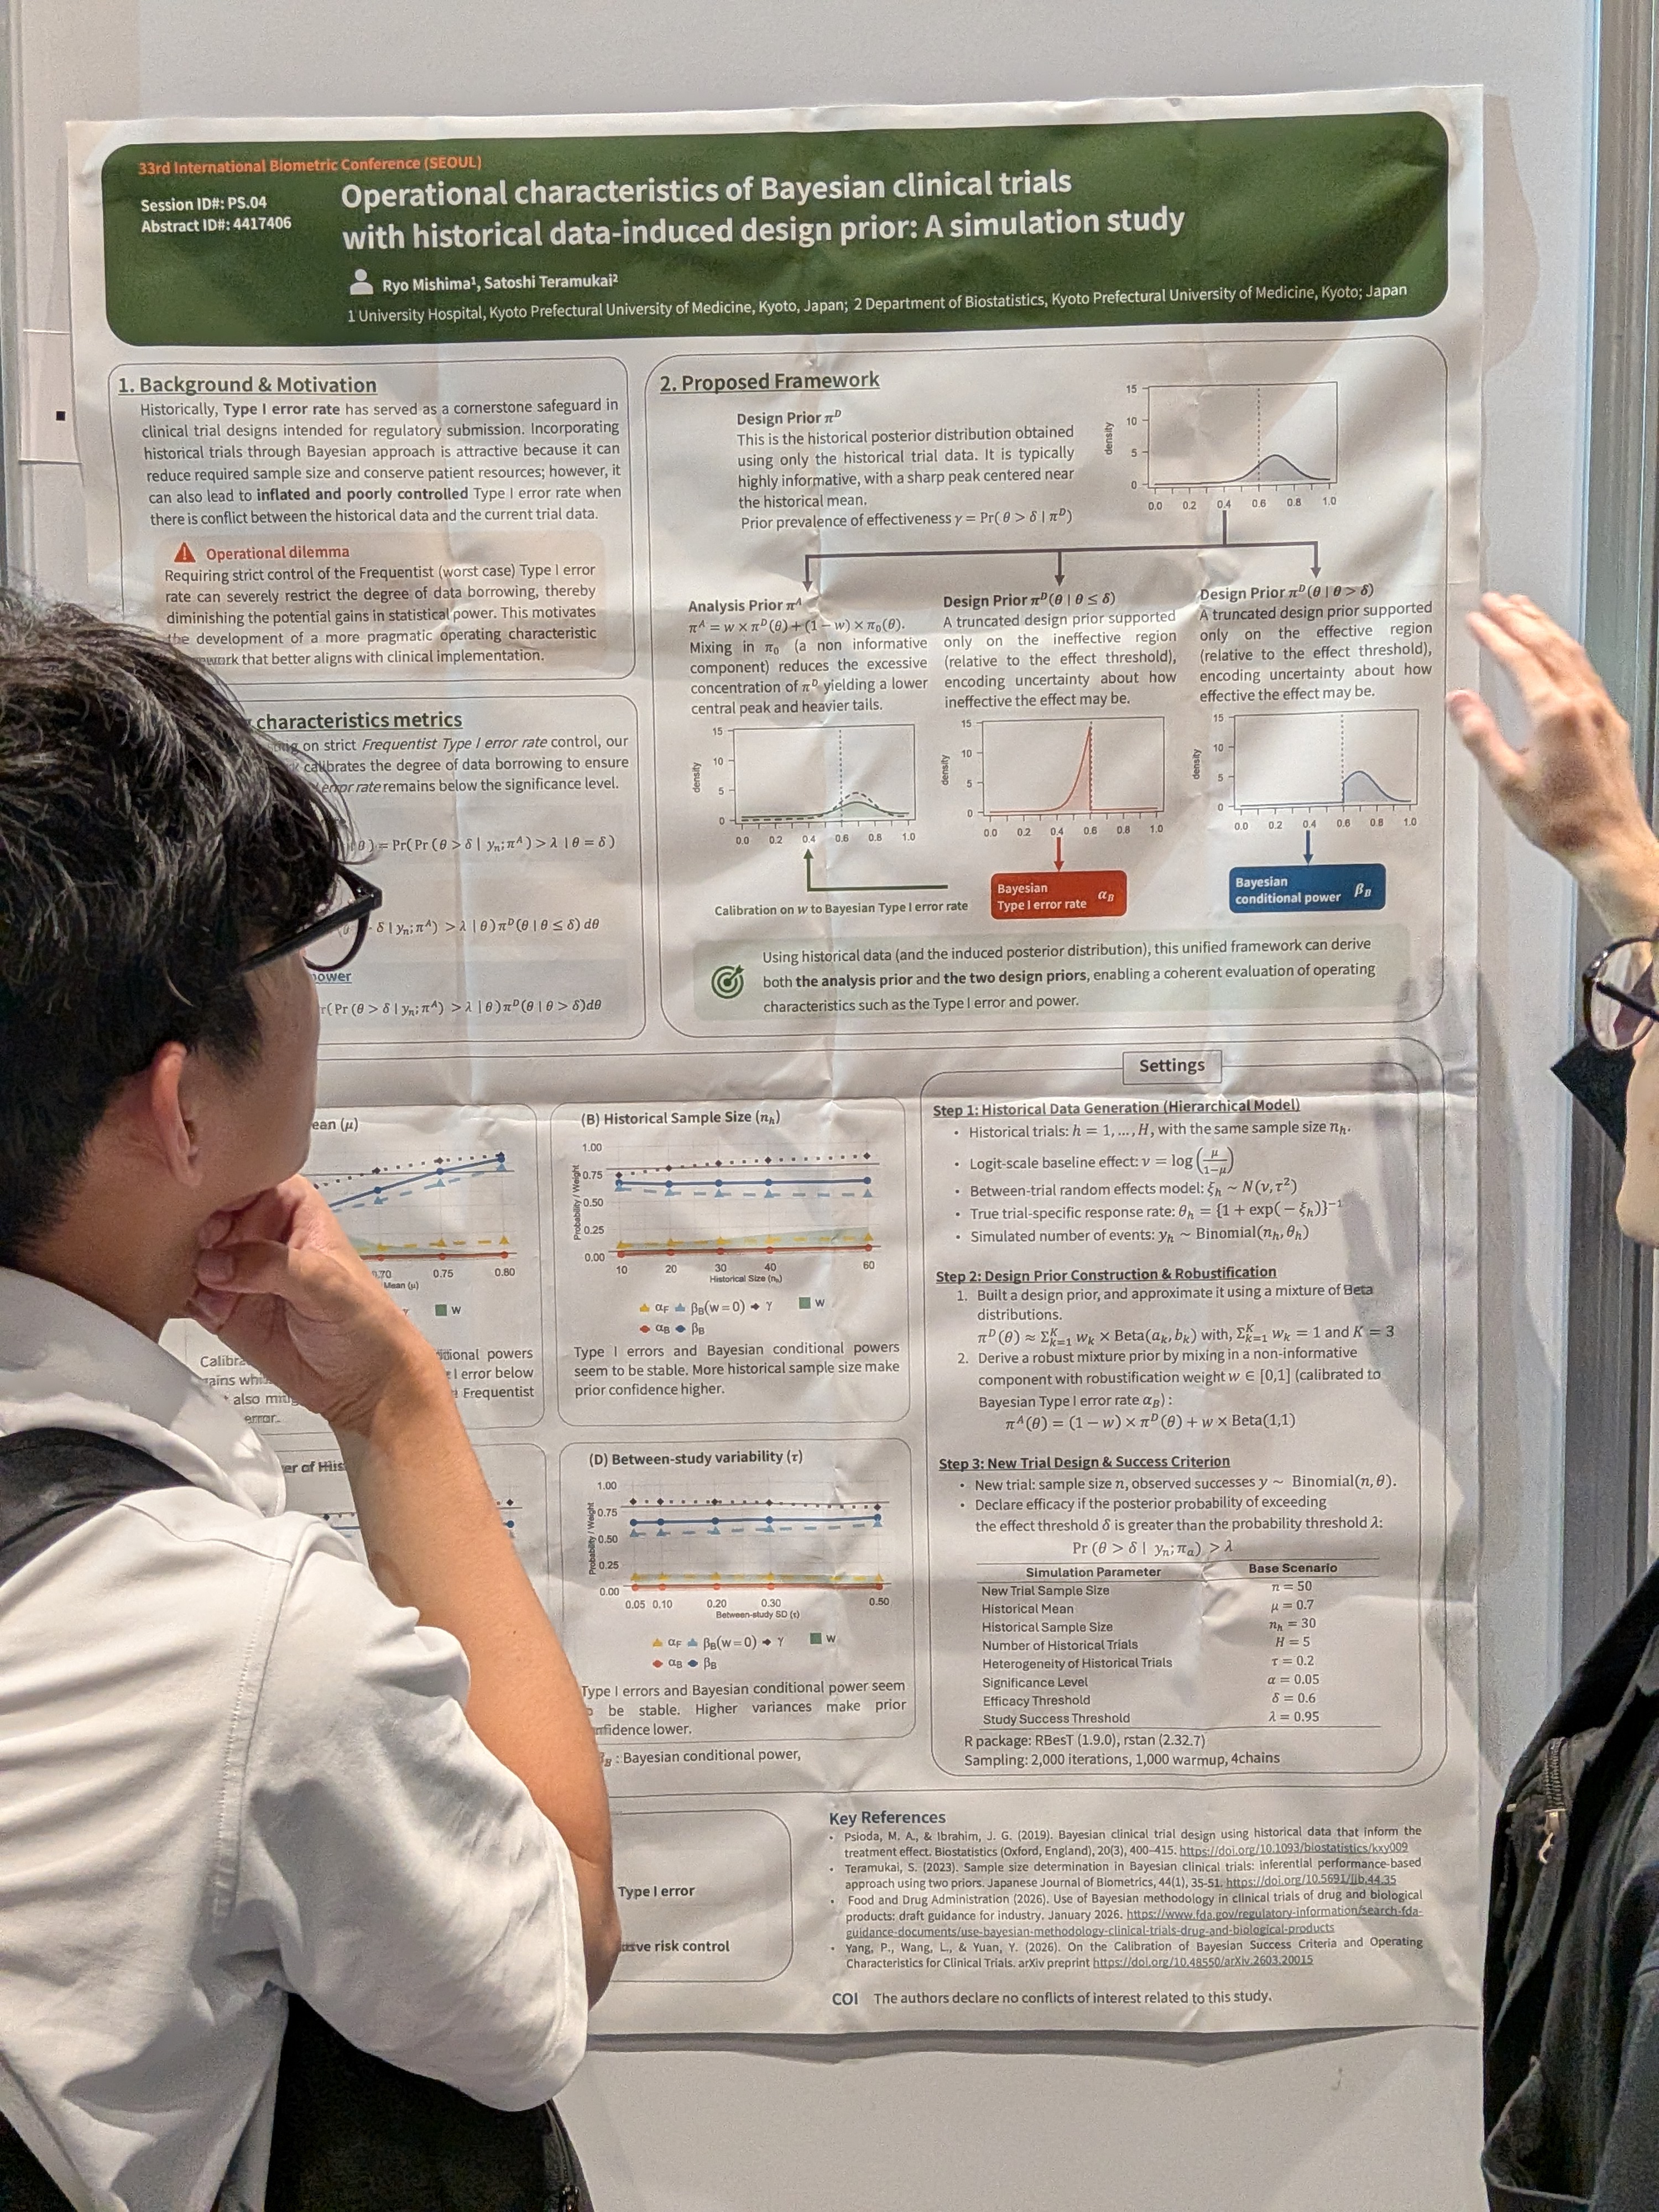
Artwork
Artwork by Daniel’s son created during the sessions.

See you in Basel
Thank you to everyone who made IBC 2026 such an inspiring conference. Hope to see you in Basel in 2028!